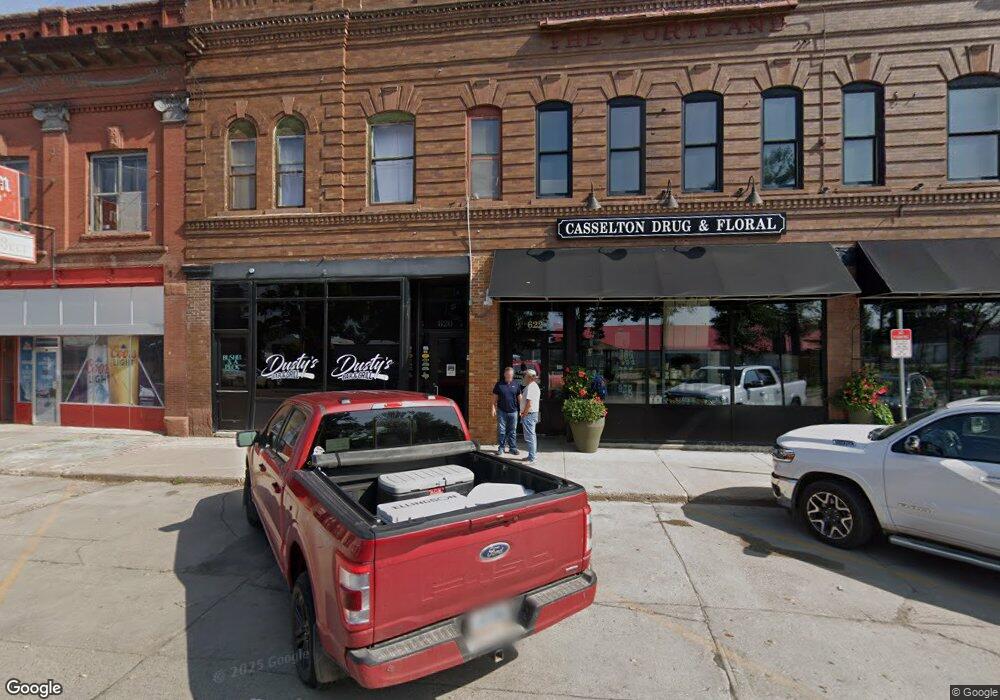
620 Front St Casselton, ND 58012
Estimated Value: $208,487
Studio
--
Bath
3,250
Sq Ft
$64/Sq Ft
Est. Value
About This Home
This home is located at 620 Front St, Casselton, ND 58012 and is currently estimated at $208,487, approximately $64 per square foot. 620 Front St is a home located in Cass County with nearby schools including Central Cass Elementary School, Central Cass Middle School, and Central Cass High School.
Ownership History
Date
Name
Owned For
Owner Type
Purchase Details
Closed on
Jan 6, 2021
Sold by
Schmaltz Propertis Llc
Bought by
The Portland Llc
Current Estimated Value
Purchase Details
Closed on
Dec 29, 2009
Sold by
Siverson John and Siverson Sylvia
Bought by
Properties Llc
Create a Home Valuation Report for This Property
The Home Valuation Report is an in-depth analysis detailing your home's value as well as a comparison with similar homes in the area
Home Values in the Area
Average Home Value in this Area
Purchase History
| Date | Buyer | Sale Price | Title Company |
|---|---|---|---|
| The Portland Llc | $150,000 | The Title Co Commercial | |
| Properties Llc | -- | -- |
Source: Public Records
Tax History
| Year | Tax Paid | Tax Assessment Tax Assessment Total Assessment is a certain percentage of the fair market value that is determined by local assessors to be the total taxable value of land and additions on the property. | Land | Improvement |
|---|---|---|---|---|
| 2024 | $238 | $4,050 | $4,050 | $0 |
| 2023 | $1,716 | $54,800 | $4,050 | $50,750 |
| 2022 | $1,704 | $54,000 | $3,250 | $50,750 |
| 2021 | $1,779 | $55,850 | $3,250 | $52,600 |
| 2020 | $1,598 | $54,000 | $3,250 | $50,750 |
| 2019 | $1,547 | $54,000 | $3,250 | $50,750 |
| 2018 | $1,528 | $54,000 | $3,250 | $50,750 |
| 2017 | $1,116 | $38,150 | $2,750 | $35,400 |
| 2016 | $996 | $38,150 | $2,750 | $35,400 |
| 2015 | $882 | $35,350 | $2,550 | $32,800 |
| 2014 | $837 | $32,100 | $2,300 | $29,800 |
| 2013 | $852 | $30,600 | $2,200 | $28,400 |
Source: Public Records
Map
Nearby Homes
Your Personal Tour Guide
Ask me questions while you tour the home.