Estimated Value: $443,765 - $534,000
5
Beds
3
Baths
2,644
Sq Ft
$182/Sq Ft
Est. Value
About This Home
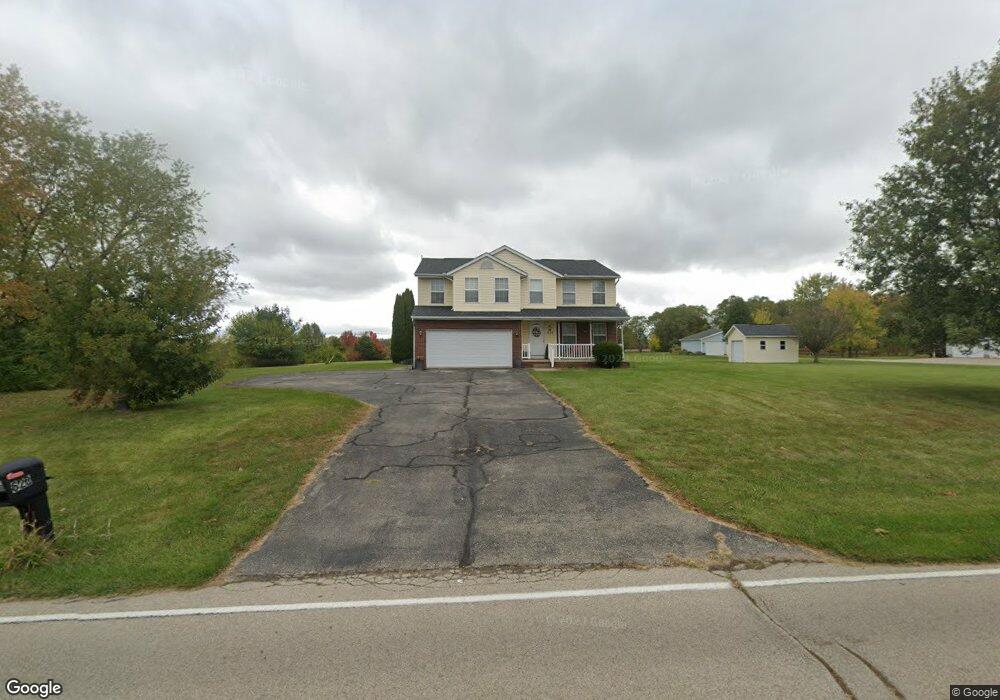
This home is located at 620 Kinsey Rd, Xenia, OH 45385 and is currently estimated at $480,191, approximately $181 per square foot. 620 Kinsey Rd is a home located in Greene County with nearby schools including Xenia High School and Legacy Christian Academy.
Ownership History
Date
Name
Owned For
Owner Type
Purchase Details
Closed on
Jun 15, 2017
Sold by
Omolewu Gabriel A and Omolewu Elizabeth A
Bought by
Damesaradeja Holdings Llc
Current Estimated Value
Purchase Details
Closed on
Oct 16, 2007
Sold by
Adams David W and Adams Vicki S
Bought by
Omolewu Gabriel A and Omolewu Elizabeth A
Home Financials for this Owner
Home Financials are based on the most recent Mortgage that was taken out on this home.
Original Mortgage
$196,650
Interest Rate
6.22%
Mortgage Type
Unknown
Purchase Details
Closed on
May 15, 1998
Sold by
Faler Jerome S and Faler Karen
Bought by
Adams David W and Adams Vicki S
Home Financials for this Owner
Home Financials are based on the most recent Mortgage that was taken out on this home.
Original Mortgage
$163,500
Interest Rate
7.19%
Create a Home Valuation Report for This Property
The Home Valuation Report is an in-depth analysis detailing your home's value as well as a comparison with similar homes in the area
Home Values in the Area
Average Home Value in this Area
Purchase History
| Date | Buyer | Sale Price | Title Company |
|---|---|---|---|
| Damesaradeja Holdings Llc | $316,000 | None Available | |
| Omolewu Gabriel A | $207,000 | None Available | |
| Adams David W | $36,000 | -- |
Source: Public Records
Mortgage History
| Date | Status | Borrower | Loan Amount |
|---|---|---|---|
| Previous Owner | Omolewu Gabriel A | $196,650 | |
| Previous Owner | Adams David W | $163,500 |
Source: Public Records
Tax History Compared to Growth
Tax History
| Year | Tax Paid | Tax Assessment Tax Assessment Total Assessment is a certain percentage of the fair market value that is determined by local assessors to be the total taxable value of land and additions on the property. | Land | Improvement |
|---|---|---|---|---|
| 2024 | $3,191 | $108,050 | $25,500 | $82,550 |
| 2023 | $3,191 | $108,050 | $25,500 | $82,550 |
| 2022 | $4,178 | $83,290 | $21,250 | $62,040 |
| 2021 | $4,235 | $83,290 | $21,250 | $62,040 |
| 2020 | $4,057 | $83,290 | $21,250 | $62,040 |
| 2019 | $4,040 | $78,080 | $21,250 | $56,830 |
| 2018 | $4,056 | $78,080 | $21,250 | $56,830 |
| 2017 | $3,939 | $78,080 | $21,250 | $56,830 |
| 2016 | $3,914 | $73,930 | $21,250 | $52,680 |
| 2015 | $3,925 | $73,930 | $21,250 | $52,680 |
| 2014 | $3,758 | $73,930 | $21,250 | $52,680 |
Source: Public Records
Map
Nearby Homes
- 983 Echo Ct
- 460 Kinsey Rd
- 1764 Highlander Dr
- 965 Oak Dale Dr
- 1359 Eagles Way
- 1311 Eagles Way
- 0 Mason Rd
- 15 Sexton Dr
- 656 Eden Roc Dr
- 0 US 42 Unit 941174
- 0 US 42 Unit 1042511
- 1287 Brush Row Rd
- 610 Saxony Dr
- 513 Redbud Ln
- 508 Marshall Dr
- 2018 Tahoe Dr
- 1171 N Detroit St
- 1038 Frederick Dr
- 2537 Ridge Rd
- 568 Louise Dr
- 626 Kinsey Rd
- 595 Kinsey Rd
- 623 Kinsey Rd
- 1010 Eastland Dr
- 1020 Eastland Dr
- 2001 Highlander Dr N
- 1050 Eastland Dr
- 2007 Highlander Dr N
- 650 Kinsey Rd
- 651 Kinsey Rd
- 1002 Eastland Dr
- 1056 Eastland Dr
- 1074 Eastland Dr
- 1086 Eastland Dr
- 1092 Eastland Dr
- 2013 Highlander Dr N
- 661 Kinsey Rd
- 1005 Eastland Dr
- 1077 Eastland Dr
- 1070 Shirley Dr