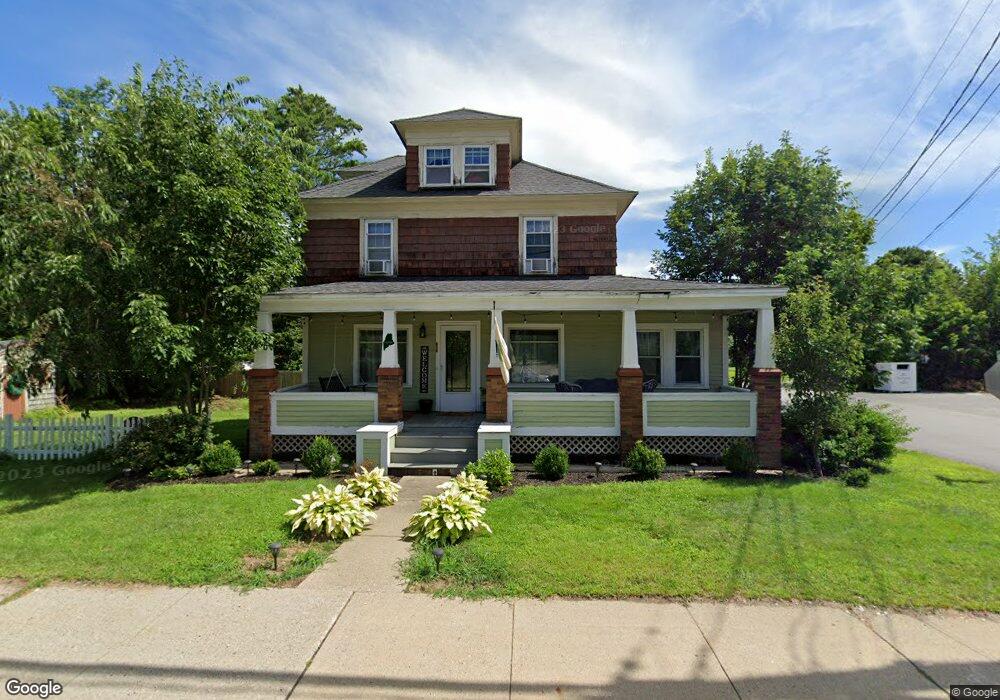
620 Main St Springvale, ME 04083
Estimated Value: $331,188 - $394,000
3
Beds
1
Bath
1,712
Sq Ft
$207/Sq Ft
Est. Value
About This Home
This home is located at 620 Main St, Springvale, ME 04083 and is currently estimated at $354,797, approximately $207 per square foot. 620 Main St is a home located in York County with nearby schools including St Thomas Consolidated School and Sanford Christian Academy.
Ownership History
Date
Name
Owned For
Owner Type
Purchase Details
Closed on
Jun 30, 2021
Sold by
Riley Martin R and Riley Nikki K
Bought by
Alipalo Melissa and Alipalo Tim
Current Estimated Value
Home Financials for this Owner
Home Financials are based on the most recent Mortgage that was taken out on this home.
Original Mortgage
$260,690
Outstanding Balance
$234,475
Interest Rate
2.9%
Mortgage Type
FHA
Estimated Equity
$120,322
Purchase Details
Closed on
Aug 16, 2005
Sold by
Wright Arline H Est and Smith
Bought by
Riley Nikki K and Riley Martin R
Home Financials for this Owner
Home Financials are based on the most recent Mortgage that was taken out on this home.
Original Mortgage
$154,000
Interest Rate
5.54%
Mortgage Type
Purchase Money Mortgage
Create a Home Valuation Report for This Property
The Home Valuation Report is an in-depth analysis detailing your home's value as well as a comparison with similar homes in the area
Home Values in the Area
Average Home Value in this Area
Purchase History
| Date | Buyer | Sale Price | Title Company |
|---|---|---|---|
| Alipalo Melissa | -- | None Available | |
| Riley Nikki K | -- | -- | |
| Riley Nikki K | -- | -- |
Source: Public Records
Mortgage History
| Date | Status | Borrower | Loan Amount |
|---|---|---|---|
| Open | Alipalo Melissa | $260,690 | |
| Previous Owner | Riley Nikki K | $154,000 |
Source: Public Records
Tax History
| Year | Tax Paid | Tax Assessment Tax Assessment Total Assessment is a certain percentage of the fair market value that is determined by local assessors to be the total taxable value of land and additions on the property. | Land | Improvement |
|---|---|---|---|---|
| 2025 | $3,764 | $220,100 | $35,000 | $185,100 |
| 2024 | $3,552 | $220,100 | $35,000 | $185,100 |
| 2023 | $3,305 | $218,300 | $35,000 | $183,300 |
| 2022 | $3,231 | $218,300 | $35,000 | $183,300 |
| 2021 | $3,142 | $172,800 | $35,000 | $137,800 |
| 2020 | $3,004 | $149,000 | $35,000 | $114,000 |
| 2019 | $2,944 | $142,200 | $35,000 | $107,200 |
| 2018 | $2,590 | $136,500 | $35,000 | $101,500 |
| 2017 | $2,688 | $129,600 | $35,000 | $94,600 |
| 2016 | $2,720 | $119,600 | $35,000 | $84,600 |
| 2015 | $2,590 | $117,500 | $35,100 | $82,400 |
| 2014 | $2,540 | $117,500 | $35,100 | $82,400 |
| 2013 | -- | $117,500 | $35,100 | $82,400 |
Source: Public Records
Map
Nearby Homes
Your Personal Tour Guide
Ask me questions while you tour the home.