620 Manning St Jefferson, MA 01522
Estimated Value: $471,896 - $549,000
About This Home
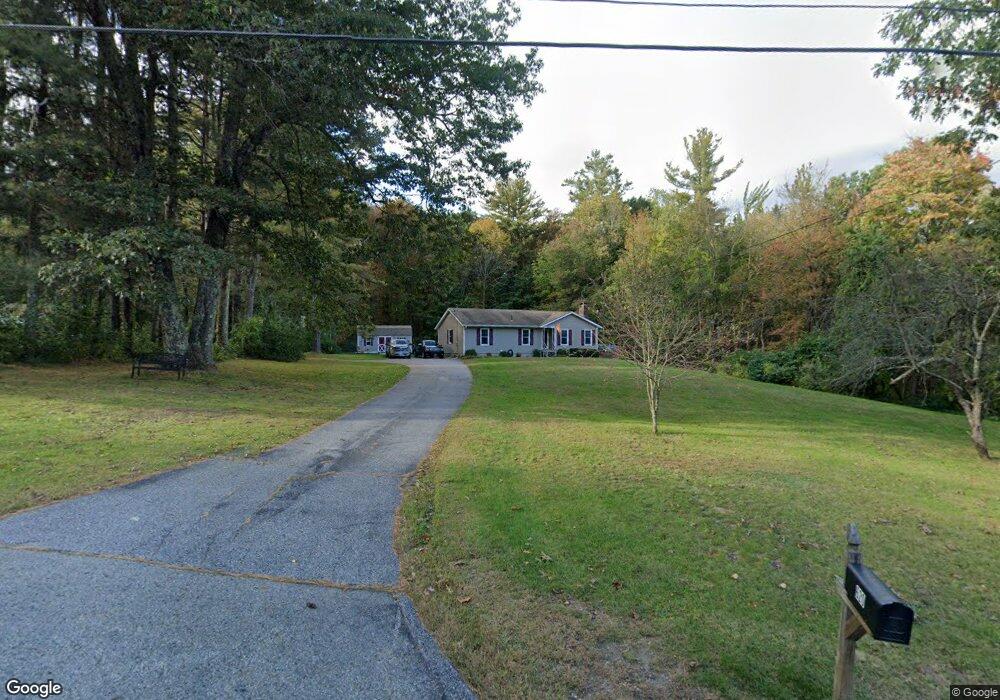
This home is located at 620 Manning St, Jefferson, MA 01522 and is currently estimated at $496,474, approximately $390 per square foot. 620 Manning St is a home located in Worcester County with nearby schools including Wachusett Regional High School.
Ownership History
We collect this data history from publicly available records. To have your information removed, we recommend requesting removal directly through your county’s website.
Purchase Details
Home Financials for this Owner
Home Financials are based on the most recent Mortgage that was taken out on this home.Home Values in the Area
Average Home Value in this Area
Purchase History
We collect this data history from publicly available records. To have your information removed, we recommend requesting removal directly through your county’s website.
| Date | Buyer | Sale Price | Title Company |
|---|---|---|---|
| $234,000 | -- | ||
| -- | -- |
Mortgage History
We collect this data history from publicly available records. To have your information removed, we recommend requesting removal directly through your county’s website.
| Date | Status | Borrower | Loan Amount |
|---|---|---|---|
| Open | $187,200 | ||
| Closed | $187,200 |
Tax History
We collect this data history from publicly available records. To have your information removed, we recommend requesting removal directly through your county’s website.
| Year | Tax Paid | Tax Assessment Tax Assessment Total Assessment is a certain percentage of the fair market value that is determined by local assessors to be the total taxable value of land and additions on the property. | Land | Improvement |
|---|---|---|---|---|
| 2025 | $5,940 | $428,600 | $172,700 | $255,900 |
| 2024 | $5,574 | $393,900 | $167,900 | $226,000 |
| 2023 | $5,369 | $358,200 | $145,800 | $212,400 |
| 2022 | $5,099 | $307,900 | $115,000 | $192,900 |
| 2021 | $4,945 | $284,200 | $109,800 | $174,400 |
| 2020 | $4,571 | $268,900 | $105,000 | $163,900 |
| 2019 | $4,509 | $258,400 | $105,000 | $153,400 |
| 2018 | $6,061 | $246,900 | $100,200 | $146,700 |
| 2017 | $4,285 | $243,600 | $100,200 | $143,400 |
| 2016 | $4,031 | $233,700 | $95,800 | $137,900 |
| 2015 | $4,034 | $222,600 | $95,800 | $126,800 |
| 2014 | $3,951 | $222,600 | $95,800 | $126,800 |
Map
- 151 Sterling Rd
- 1138 Wachusett St
- 1202 Wachusett St
- 8 Elmwood Ave
- 1093 Wachusett St
- 56 Malden St
- 89 Boulder Hill Rd
- 848 Wachusett St
- 34 Fort Sumter Dr
- 2 Fox Run Rd
- Lot B Union St
- 30 Cimarron Ln
- 64 Deanna Dr
- 396 Elmwood Ave
- 30 Central St
- 6 Church St
- 13 Deanna Dr
- 263 Highland St
- 87 Deanna Dr
- 81 Deanna Dr
- 619 Manning St
- 630 Manning St
- 615 Manning St
- 635 Manning St
- 651 Manning St
- 600 Manning St
- 605 Manning St
- 650 Manning St
- 585 Manning St
- 661 Manning St
- 296 Laurel St
- 291 Laurel St
- 650 Manning St
- 286 Laurel St
- 1 Raymond Huntington Hwy
- 555 Manning St
- 550 Manning St
- 619 Manning St
- 520 Manning St
- 518 Manning St
Ask me questions while you tour the home.