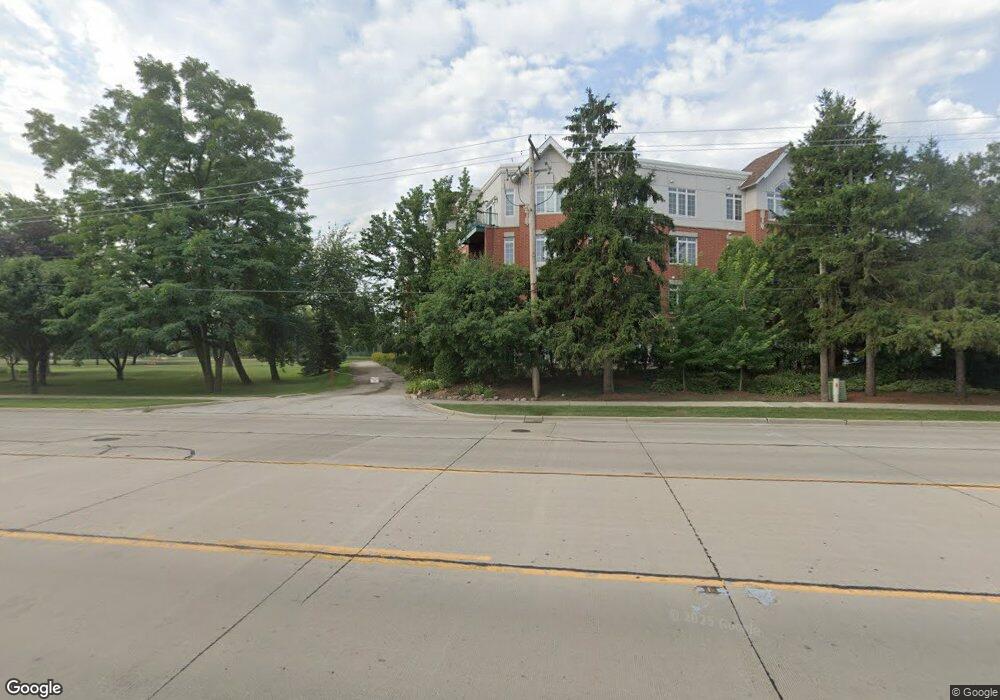
620 Mchenry Rd Unit 3103 Wheeling, IL 60090
Estimated Value: $288,236 - $376,000
2
Beds
--
Bath
30,000
Sq Ft
$11/Sq Ft
Est. Value
About This Home
This home is located at 620 Mchenry Rd Unit 3103, Wheeling, IL 60090 and is currently estimated at $344,559, approximately $11 per square foot. 620 Mchenry Rd Unit 3103 is a home located in Cook County with nearby schools including Joyce Kilmer Elementary School, Cooper Middle School, and Buffalo Grove High School.
Ownership History
Date
Name
Owned For
Owner Type
Purchase Details
Closed on
Sep 13, 2023
Sold by
741 Hastings Llc
Bought by
Trouver Llc
Current Estimated Value
Purchase Details
Closed on
Sep 26, 2008
Sold by
Fannie Mae
Bought by
Adler Richard
Home Financials for this Owner
Home Financials are based on the most recent Mortgage that was taken out on this home.
Original Mortgage
$134,400
Interest Rate
6.41%
Mortgage Type
Purchase Money Mortgage
Purchase Details
Closed on
Sep 25, 2007
Sold by
Breyer Jerry
Bought by
Federal National Mortgage Association
Purchase Details
Closed on
Jun 8, 2004
Sold by
Park Point At Wheeling Llc
Bought by
Breyer Jerry
Home Financials for this Owner
Home Financials are based on the most recent Mortgage that was taken out on this home.
Original Mortgage
$208,000
Interest Rate
6.39%
Mortgage Type
Unknown
Create a Home Valuation Report for This Property
The Home Valuation Report is an in-depth analysis detailing your home's value as well as a comparison with similar homes in the area
Home Values in the Area
Average Home Value in this Area
Purchase History
| Date | Buyer | Sale Price | Title Company |
|---|---|---|---|
| Trouver Llc | $330,000 | Near North Title | |
| Adler Richard | -- | Git | |
| Federal National Mortgage Association | -- | Git | |
| Breyer Jerry | $260,000 | Chicago Title Insurance Comp |
Source: Public Records
Mortgage History
| Date | Status | Borrower | Loan Amount |
|---|---|---|---|
| Previous Owner | Adler Richard | $134,400 | |
| Previous Owner | Breyer Jerry | $208,000 | |
| Closed | Breyer Jerry | $52,000 |
Source: Public Records
Tax History
| Year | Tax Paid | Tax Assessment Tax Assessment Total Assessment is a certain percentage of the fair market value that is determined by local assessors to be the total taxable value of land and additions on the property. | Land | Improvement |
|---|---|---|---|---|
| 2025 | $4,272 | $26,595 | $2,040 | $24,555 |
| 2024 | $4,272 | $18,716 | $1,700 | $17,016 |
| 2023 | $4,014 | $18,716 | $1,700 | $17,016 |
| 2022 | $4,014 | $18,716 | $1,700 | $17,016 |
| 2021 | $1,541 | $13,950 | $283 | $13,667 |
| 2020 | $1,398 | $13,950 | $283 | $13,667 |
| 2019 | $1,403 | $15,611 | $283 | $15,328 |
| 2018 | $1,315 | $10,474 | $226 | $10,248 |
| 2017 | $2,538 | $10,474 | $226 | $10,248 |
| 2016 | $2,661 | $10,474 | $226 | $10,248 |
| 2015 | $2,508 | $9,663 | $963 | $8,700 |
| 2014 | $2,466 | $9,663 | $963 | $8,700 |
| 2013 | $2,257 | $9,663 | $963 | $8,700 |
Source: Public Records
Map
Nearby Homes
- 640 Mchenry Rd Unit 301
- 1052 Southbury Ln Unit 1
- 550 Greystone Ln Unit A2
- 575 Greystone Ln Unit A2
- 842 Colonial Dr Unit B
- 822 Colonial Dr Unit B
- 1050 Driftwood Ct Unit 1
- 813 Valley Stream Dr Unit D
- 586 Fairway View Dr Unit 2C
- 586 Fairway View Dr Unit 1A
- 1133 Hawthorne Ct Unit A2
- 588 Fairway View Dr Unit 2E
- 1324 Alpine Ct Unit 104
- 1168 Northbury Ln Unit 1
- 1314 Ely Ct Unit 80
- 1410 Tulip Ct Unit D2
- 424 Le Parc Cir Unit 275
- 88 W Wayne Place
- 350 E Dundee Rd Unit 207B
- 1606 Stratford Ct Unit C2
- 620 Mchenry Rd Unit 303
- 620 Mchenry Rd Unit 206
- 620 Mchenry Rd Unit 3306
- 620 Mchenry Rd Unit 3201
- 620 Mchenry Rd Unit 3205
- 620 Mchenry Rd Unit 3203
- 620 Mchenry Rd Unit 3408
- 620 Mchenry Rd Unit 3302
- 620 Mchenry Rd Unit 3105
- 620 Mchenry Rd Unit 3206
- 620 Mchenry Rd Unit 3407
- 620 Mchenry Rd Unit 3406
- 620 Mchenry Rd Unit 3405
- 620 Mchenry Rd Unit 3404
- 620 Mchenry Rd Unit 3403
- 620 Mchenry Rd Unit 3402
- 620 Mchenry Rd Unit 3401
- 620 Mchenry Rd Unit 3308
- 620 Mchenry Rd Unit 3307
- 620 Mchenry Rd Unit 3305
Your Personal Tour Guide
Ask me questions while you tour the home.