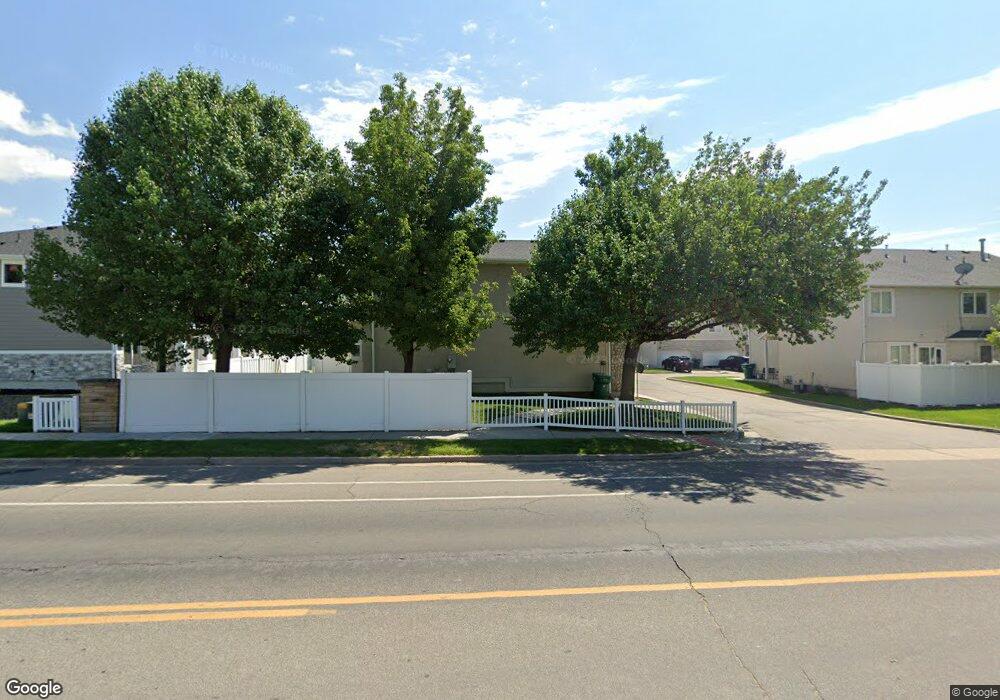
620 N Fairfield Rd Layton, UT 84041
Estimated Value: $314,000 - $391,000
3
Beds
2
Baths
1,589
Sq Ft
$226/Sq Ft
Est. Value
About This Home
This home is located at 620 N Fairfield Rd, Layton, UT 84041 and is currently estimated at $358,439, approximately $225 per square foot. 620 N Fairfield Rd is a home located in Davis County with nearby schools including King Elementary School, Central Davis Junior High School, and Layton High School.
Ownership History
Date
Name
Owned For
Owner Type
Purchase Details
Closed on
Oct 2, 2006
Sold by
Interwest Associates Inc
Bought by
Royal Lorraine Llc
Current Estimated Value
Purchase Details
Closed on
Aug 12, 2004
Sold by
Griffin Max
Bought by
Interwest Associates Inc
Purchase Details
Closed on
Jun 27, 2000
Sold by
Griffin Max D
Bought by
Griffin Max and The Max Griffin Trust
Purchase Details
Closed on
Mar 28, 2000
Sold by
Griffin Max
Bought by
Griffin Max D
Home Financials for this Owner
Home Financials are based on the most recent Mortgage that was taken out on this home.
Original Mortgage
$136,800
Interest Rate
7.62%
Mortgage Type
Purchase Money Mortgage
Purchase Details
Closed on
Mar 22, 2000
Sold by
Interwest Construction Company Inc
Bought by
Griffin Max
Home Financials for this Owner
Home Financials are based on the most recent Mortgage that was taken out on this home.
Original Mortgage
$136,800
Interest Rate
7.62%
Mortgage Type
Purchase Money Mortgage
Create a Home Valuation Report for This Property
The Home Valuation Report is an in-depth analysis detailing your home's value as well as a comparison with similar homes in the area
Home Values in the Area
Average Home Value in this Area
Purchase History
| Date | Buyer | Sale Price | Title Company |
|---|---|---|---|
| Royal Lorraine Llc | -- | Aspen Title Insurance | |
| Interwest Associates Inc | -- | Aspen Title Ins Agency L | |
| Griffin Max | -- | -- | |
| Griffin Max D | -- | United Title Services | |
| Griffin Max | -- | United Title Services |
Source: Public Records
Mortgage History
| Date | Status | Borrower | Loan Amount |
|---|---|---|---|
| Previous Owner | Griffin Max D | $136,800 |
Source: Public Records
Tax History
| Year | Tax Paid | Tax Assessment Tax Assessment Total Assessment is a certain percentage of the fair market value that is determined by local assessors to be the total taxable value of land and additions on the property. | Land | Improvement |
|---|---|---|---|---|
| 2025 | $1,776 | $186,450 | $52,800 | $133,650 |
| 2024 | $1,732 | $183,150 | $49,500 | $133,650 |
| 2023 | $1,792 | $183,700 | $49,500 | $134,200 |
| 2022 | $1,842 | $339,000 | $61,000 | $278,000 |
| 2021 | $1,762 | $266,000 | $53,000 | $213,000 |
| 2020 | $1,650 | $239,000 | $54,100 | $184,900 |
| 2019 | $1,643 | $233,000 | $52,000 | $181,000 |
| 2018 | $1,419 | $202,000 | $52,000 | $150,000 |
| 2016 | $1,239 | $91,025 | $17,600 | $73,425 |
| 2015 | $1,240 | $86,460 | $17,600 | $68,860 |
| 2014 | $1,251 | $89,233 | $18,333 | $70,900 |
| 2013 | -- | $80,600 | $15,950 | $64,650 |
Source: Public Records
Map
Nearby Homes
- 861 E 575 N
- 857 E 575 N
- 556 N Fairfield Rd Unit A2
- 556 N Fairfield Rd Unit D1
- 556 N Fairfield Rd Unit D2
- 556 N Fairfield Rd Unit A3
- 556 N Fairfield Rd Unit D3
- 556 N Fairfield Rd Unit D4
- 556 N Fairfield Rd Unit A1
- 556 N Fairfield Rd Unit A4
- 508 N Adamswood Rd
- 800 Kirk St
- 654 Colonial St
- 618 Valeria Dr
- 997 E 825 N
- 794 Valeria Dr
- 431 N 1050 E
- 806 Valeria Dr
- 187 N Talbot Dr
- 479 N 1375 E
- 620 N Fairfield Rd Unit 16
- 620 N Fairfield Rd
- 620 N Fairfield Rd Unit 14
- 620 N Fairfield Rd Unit 13
- 620 N Fairfield Rd Unit 12
- 620 N Fairfield Rd Unit 11
- 620 N Fairfield Rd Unit 10
- 620 N Fairfield Rd Unit 9
- 620 N Fairfield Rd Unit 8
- 620 N Fairfield Rd Unit 7
- 620 N Fairfield Rd Unit 6
- 620 N Fairfield Rd
- 620 N Fairfield Rd Unit 3
- 620 N Fairfield Rd Unit 2
- 620 N Fairfield Rd
- 620 N Fairfield Rd Unit 4
- 620 N Fairfield Rd Unit 5
- 620 N Fairfield Rd Unit 15
- 620 N Fairfield Rd Unit 1
- 897 E Robert Ave