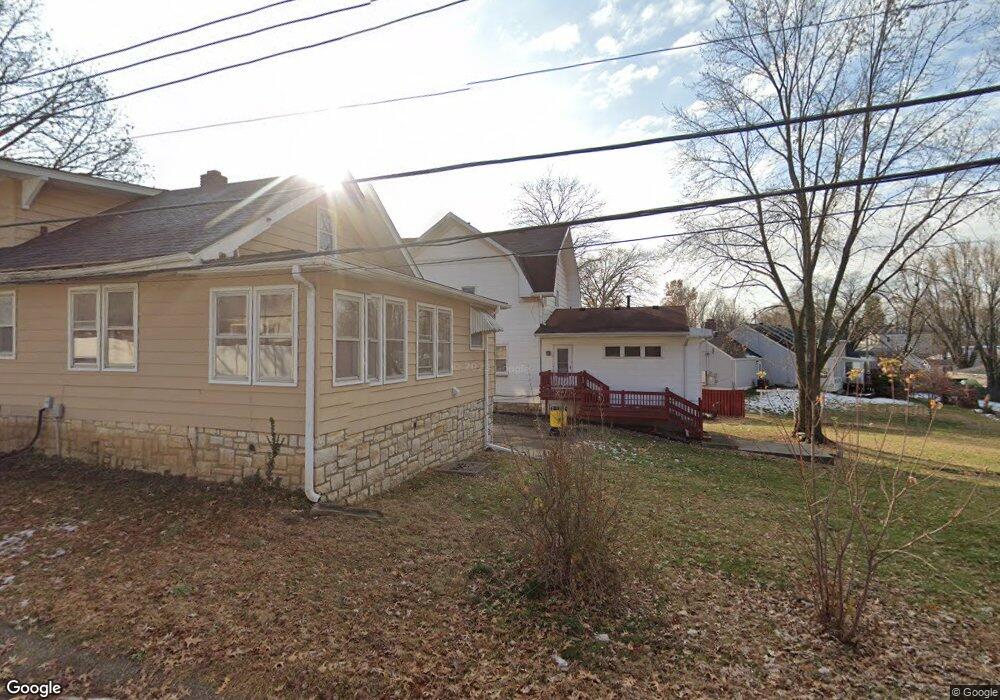
620 N Kimball St Excelsior Springs, MO 64024
Estimated Value: $229,000 - $275,000
3
Beds
2
Baths
1,923
Sq Ft
$129/Sq Ft
Est. Value
About This Home
This home is located at 620 N Kimball St, Excelsior Springs, MO 64024 and is currently estimated at $247,382, approximately $128 per square foot. 620 N Kimball St is a home located in Clay County with nearby schools including Excelsior Springs High School.
Ownership History
Date
Name
Owned For
Owner Type
Purchase Details
Closed on
Sep 25, 2008
Sold by
Milburn Nathaniel J and Milburn Lori
Bought by
Blubaugh Reuben and Blubaugh Barbara
Current Estimated Value
Home Financials for this Owner
Home Financials are based on the most recent Mortgage that was taken out on this home.
Original Mortgage
$52,000
Interest Rate
6.35%
Mortgage Type
Purchase Money Mortgage
Purchase Details
Closed on
Dec 26, 2007
Sold by
Mclendon Shelley J
Bought by
Milburn Nathaniel J
Purchase Details
Closed on
Apr 23, 2003
Sold by
Hud
Bought by
Mclendon Richard A
Purchase Details
Closed on
Nov 25, 2002
Sold by
Us Bank Na
Bought by
Hud
Purchase Details
Closed on
Jul 19, 2002
Sold by
Rambo Michael G and Rambo Emma L
Bought by
U S Bank Na
Purchase Details
Closed on
Mar 6, 1997
Sold by
Emery Edward Stephen and Emery Heidi
Bought by
Rambo Michael and Rambo Michael G
Home Financials for this Owner
Home Financials are based on the most recent Mortgage that was taken out on this home.
Original Mortgage
$80,276
Interest Rate
7.88%
Mortgage Type
FHA
Create a Home Valuation Report for This Property
The Home Valuation Report is an in-depth analysis detailing your home's value as well as a comparison with similar homes in the area
Home Values in the Area
Average Home Value in this Area
Purchase History
| Date | Buyer | Sale Price | Title Company |
|---|---|---|---|
| Blubaugh Reuben | -- | Stewart Title Kansas City In | |
| Milburn Nathaniel J | -- | None Available | |
| Mclendon Richard A | -- | Mississippi Valley Title | |
| Hud | -- | -- | |
| U S Bank Na | $88,201 | -- | |
| Rambo Michael | -- | -- |
Source: Public Records
Mortgage History
| Date | Status | Borrower | Loan Amount |
|---|---|---|---|
| Closed | Blubaugh Reuben | $52,000 | |
| Previous Owner | Rambo Michael | $80,276 |
Source: Public Records
Tax History Compared to Growth
Tax History
| Year | Tax Paid | Tax Assessment Tax Assessment Total Assessment is a certain percentage of the fair market value that is determined by local assessors to be the total taxable value of land and additions on the property. | Land | Improvement |
|---|---|---|---|---|
| 2025 | $2,231 | $36,540 | -- | -- |
| 2024 | $2,231 | $31,810 | -- | -- |
| 2023 | $2,217 | $31,810 | $0 | $0 |
| 2022 | $1,856 | $26,200 | $0 | $0 |
| 2021 | $1,863 | $26,201 | $2,052 | $24,149 |
| 2020 | $1,670 | $22,820 | $0 | $0 |
| 2019 | $1,668 | $22,820 | $0 | $0 |
| 2018 | $1,519 | $20,710 | $0 | $0 |
| 2017 | $1,394 | $20,710 | $2,050 | $18,660 |
| 2016 | $1,394 | $19,490 | $2,050 | $17,440 |
| 2015 | $1,407 | $19,490 | $2,050 | $17,440 |
| 2014 | $1,378 | $18,920 | $2,050 | $16,870 |
Source: Public Records
Map
Nearby Homes
- 507 N Kimball St
- 934 Williams St
- 1101 Williams St
- 400 Beverly Ave
- 110 Ridgeway St
- 332 Woods Ave
- 214 Oakwood Ave
- 124 Wildwood St
- 101 W Excelsior St
- 304 Waller Ave
- 256 E Broadway Ave
- 607 Old Orchard Ave
- 106 Saratoga St
- 602 Saint Louis Ave
- 1229 Michele Dr
- 115 Saratoga Ave
- 610 St Louis Ave
- 1318 Kristie Cir
- 1017 Rose Ave
- 106 Helen St
- 624 N Kimball St
- 895 Williams St
- 614 N Kimball St
- 897 Williams St
- 899 Williams St
- 704 N Kimball St
- 605 N Kimball St
- 622 Dunbar St
- 602 N Kimball St
- 624 Dunbar St
- 920 Saint Paul St
- 705 Curran St
- 901 Williams St
- 920 W Saint Paul Ave
- 606 Dunbar St
- 603 N Kimball St
- 716 Dunbar St
- 604 Dunbar St
- 930 Saint Paul St
- 900 Williams St