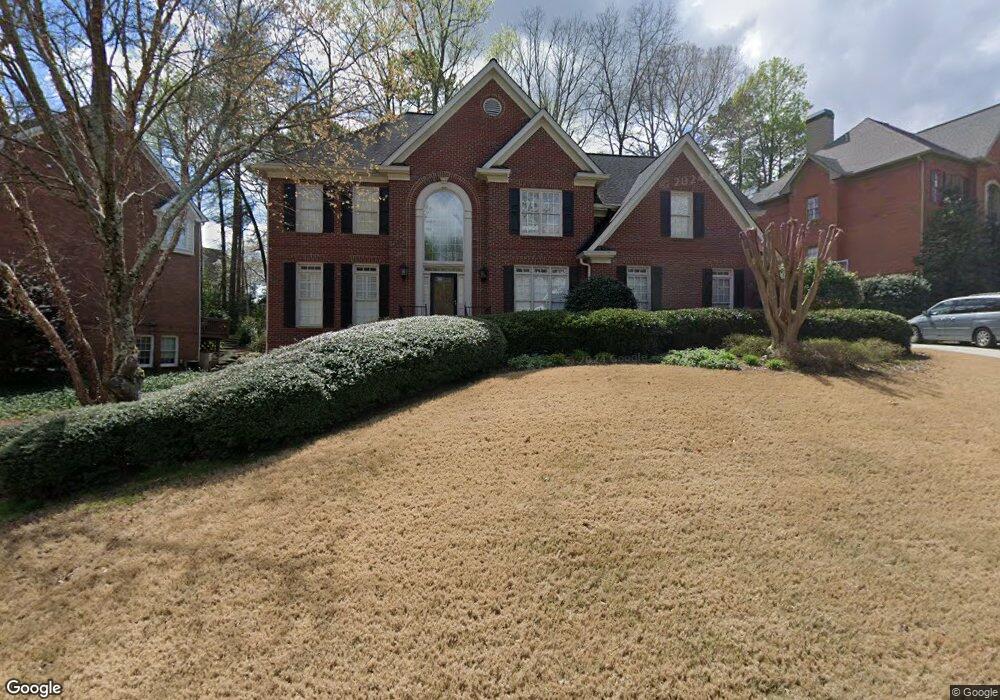
620 Rain Willow Ln Unit 3 Duluth, GA 30097
Estimated Value: $789,000 - $930,000
4
Beds
4
Baths
3,416
Sq Ft
$250/Sq Ft
Est. Value
About This Home
This home is located at 620 Rain Willow Ln Unit 3, Duluth, GA 30097 and is currently estimated at $852,442, approximately $249 per square foot. 620 Rain Willow Ln Unit 3 is a home located in Fulton County with nearby schools including Wilson Creek Elementary School, River Trail Middle School, and Northview High School.
Ownership History
Date
Name
Owned For
Owner Type
Purchase Details
Closed on
May 13, 2003
Sold by
Southern Deborah
Bought by
Redman Randall and Redman Aileen
Current Estimated Value
Home Financials for this Owner
Home Financials are based on the most recent Mortgage that was taken out on this home.
Original Mortgage
$225,000
Outstanding Balance
$97,932
Interest Rate
5.81%
Mortgage Type
New Conventional
Estimated Equity
$754,510
Purchase Details
Closed on
Aug 6, 2001
Sold by
Southern John M
Bought by
Southern Deborah
Purchase Details
Closed on
Jul 22, 1998
Sold by
Southern John M
Bought by
Southern John M and Southern Deborah B
Home Financials for this Owner
Home Financials are based on the most recent Mortgage that was taken out on this home.
Original Mortgage
$246,200
Interest Rate
6.97%
Mortgage Type
New Conventional
Purchase Details
Closed on
Jul 7, 1995
Sold by
Fuqua Const Co
Bought by
Southern John M Deborah
Create a Home Valuation Report for This Property
The Home Valuation Report is an in-depth analysis detailing your home's value as well as a comparison with similar homes in the area
Purchase History
| Date | Buyer | Sale Price | Title Company |
|---|---|---|---|
| Redman Randall | $380,000 | -- | |
| Southern Deborah | -- | -- | |
| Southern John M | -- | -- | |
| Southern John M | -- | -- | |
| Southern John M Deborah | $309,000 | -- |
Source: Public Records
Mortgage History
| Date | Status | Borrower | Loan Amount |
|---|---|---|---|
| Open | Redman Randall | $225,000 | |
| Previous Owner | Southern John M | $246,200 | |
| Closed | Southern John M Deborah | $0 |
Source: Public Records
Tax History
| Year | Tax Paid | Tax Assessment Tax Assessment Total Assessment is a certain percentage of the fair market value that is determined by local assessors to be the total taxable value of land and additions on the property. | Land | Improvement |
|---|---|---|---|---|
| 2025 | $6,443 | $320,000 | $118,360 | $201,640 |
| 2023 | $8,906 | $315,520 | $95,720 | $219,800 |
| 2022 | $6,180 | $269,800 | $83,120 | $186,680 |
| 2021 | $6,121 | $223,000 | $67,840 | $155,160 |
| 2020 | $6,165 | $212,440 | $57,160 | $155,280 |
| 2019 | $741 | $216,800 | $70,400 | $146,400 |
| 2018 | $6,328 | $211,680 | $68,720 | $142,960 |
| 2017 | $6,108 | $191,720 | $72,520 | $119,200 |
| 2016 | $5,987 | $191,720 | $72,520 | $119,200 |
| 2015 | $6,051 | $191,720 | $72,520 | $119,200 |
| 2014 | $5,598 | $171,760 | $58,280 | $113,480 |
Source: Public Records
Map
Nearby Homes
- 6390 Whitestone Place
- 4099 Abbotts Bridge Rd
- 6273 Clapham Ln
- 1195 Rugglestone Way Unit 7C
- 6325 Barwick Ln
- 7080 Sweet Creek Rd
- 850 Abbotts Mill Ct Unit 79
- 755 Abbotts Mill Ct Unit 69
- 795 Abbotts Mill Ct Unit 73
- 540 Abbotts Mill Dr
- 355 Hurst Bourne Ln
- 400 Stedford Ln
- 1305 Simonds Way
- 1001 Shurcliff Ln
- 6415 Stapleford Ln
- 10567 Bent Tree View
- 10823 Yorkwood St
- 10840 Yorkwood St
- 10844 Yorkwood St
- 3052 Brindale Dr
- 630 Rain Willow Ln Unit 3
- 640 Rain Willow Ln
- 115 Silk Leaf Dr
- 645 Rain Willow Ln Unit 3
- 125 Silk Leaf Dr
- 655 Rain Willow Ln
- 625 Rain Willow Ln
- 10585 Honey Brook Cir Unit IB
- 635 Rain Willow Ln
- 105 Silk Leaf Dr
- 650 Rain Willow Ln Unit 3
- 650 Rain Willow Ln
- 135 Silk Leaf Dr
- 615 Rain Willow Ln Unit 3
- 665 Rain Willow Ln
- 605 Rain Willow Ln
- 660 Rain Willow Ln Unit 3
- 110 Silk Leaf Dr
- 675 Rain Willow Ln Unit 3
- 100 Silk Leaf Dr
Your Personal Tour Guide
Ask me questions while you tour the home.