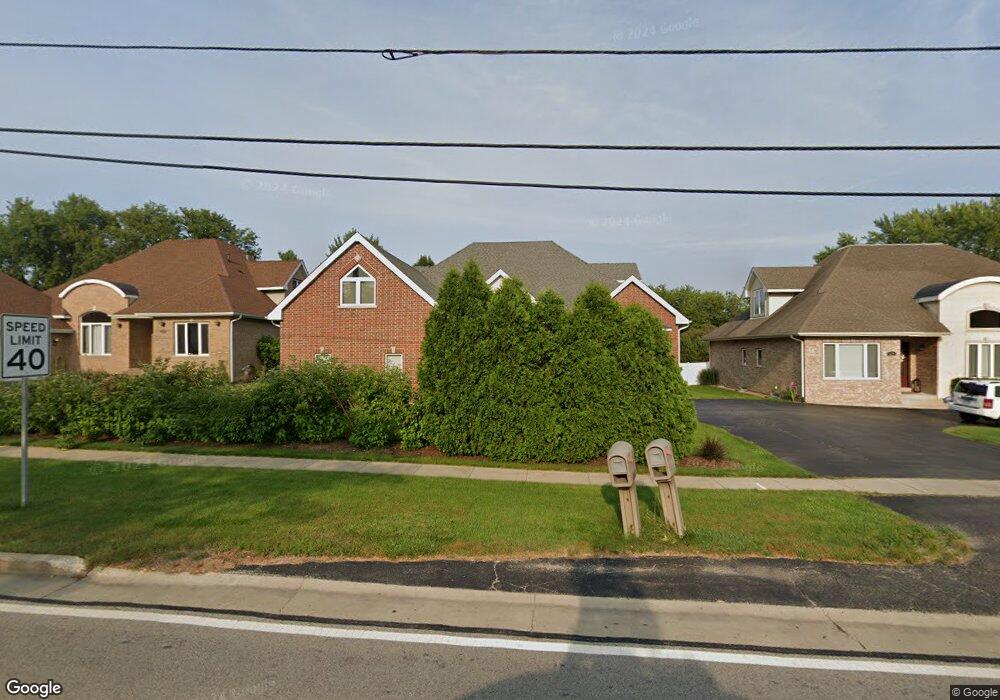
620 S Butterfield Rd Libertyville, IL 60048
South Libertyville NeighborhoodEstimated Value: $680,000 - $1,056,000
4
Beds
4
Baths
4,178
Sq Ft
$203/Sq Ft
Est. Value
About This Home
This home is located at 620 S Butterfield Rd, Libertyville, IL 60048 and is currently estimated at $848,900, approximately $203 per square foot. 620 S Butterfield Rd is a home located in Lake County with nearby schools including Copeland Manor Elementary School, Highland Middle School, and Libertyville High School.
Ownership History
Date
Name
Owned For
Owner Type
Purchase Details
Closed on
Nov 22, 2017
Sold by
Right Residential Ii Fund 3 Llc
Bought by
Baltoski Dragi
Current Estimated Value
Home Financials for this Owner
Home Financials are based on the most recent Mortgage that was taken out on this home.
Original Mortgage
$316,000
Outstanding Balance
$266,659
Interest Rate
4.12%
Mortgage Type
New Conventional
Estimated Equity
$582,241
Purchase Details
Closed on
Apr 24, 2017
Sold by
Zaltsman
Bought by
Right Residential Ii Fund 3 Llc
Purchase Details
Closed on
Nov 28, 2012
Sold by
Plavnik Svetlana and Plavnik Julia
Bought by
Zaltsman Dimitry and Plavnik Larisa
Home Financials for this Owner
Home Financials are based on the most recent Mortgage that was taken out on this home.
Original Mortgage
$405,000
Interest Rate
3.38%
Mortgage Type
New Conventional
Purchase Details
Closed on
Jun 30, 2008
Sold by
Zaltsman Dimitry and Plavnik Larisa
Bought by
Zaltsman Dimitry and Plavnik Larisa
Create a Home Valuation Report for This Property
The Home Valuation Report is an in-depth analysis detailing your home's value as well as a comparison with similar homes in the area
Home Values in the Area
Average Home Value in this Area
Purchase History
| Date | Buyer | Sale Price | Title Company |
|---|---|---|---|
| Baltoski Dragi | $395,000 | First American Title | |
| Right Residential Ii Fund 3 Llc | $376,000 | Attorney | |
| Zaltsman Dimitry | -- | Success Title Services Inc | |
| Zaltsman Dimitry | -- | None Available |
Source: Public Records
Mortgage History
| Date | Status | Borrower | Loan Amount |
|---|---|---|---|
| Open | Baltoski Dragi | $316,000 | |
| Previous Owner | Zaltsman Dimitry | $405,000 |
Source: Public Records
Tax History Compared to Growth
Tax History
| Year | Tax Paid | Tax Assessment Tax Assessment Total Assessment is a certain percentage of the fair market value that is determined by local assessors to be the total taxable value of land and additions on the property. | Land | Improvement |
|---|---|---|---|---|
| 2024 | $15,452 | $216,698 | $41,251 | $175,447 |
| 2023 | $18,291 | $199,869 | $38,047 | $161,822 |
| 2022 | $18,291 | $234,699 | $36,571 | $198,128 |
| 2021 | $17,614 | $229,647 | $35,784 | $193,863 |
| 2020 | $16,955 | $225,786 | $35,182 | $190,604 |
| 2019 | $16,532 | $223,639 | $34,847 | $188,792 |
| 2018 | $13,436 | $185,850 | $41,101 | $144,749 |
| 2017 | $13,478 | $179,982 | $39,803 | $140,179 |
| 2016 | $18,441 | $240,964 | $37,739 | $203,225 |
| 2015 | $18,327 | $225,221 | $35,273 | $189,948 |
| 2014 | $17,118 | $206,127 | $33,143 | $172,984 |
| 2012 | -- | $207,915 | $33,430 | $174,485 |
Source: Public Records
Map
Nearby Homes
- 1137 Pine Tree Ln
- 20924 & 20902 W Park Ave
- 1330 W Park Ave
- 533 Drake St
- 223 Kenloch Ave
- 2245 Hazeltime Dr
- 0 Ames St
- 1017 Juniper Pkwy
- 423 Ames St
- 777 Garfield Ave Unit A
- 422 Shadow Creek Dr
- 747 Garfield Ave Unit C
- 551 W Park Ave Unit E
- 851 Garfield Ave Unit C
- 323 W Golf Rd
- 501 Hemlock Ln
- 847 Mckinley Ave
- 308 Mckinley Ave
- 328 Brice Ave
- 1969 Royal Birkdale Dr
- 616 S Butterfield Rd
- 624 S Butterfield Rd
- 633 Nordic Ct
- 631 Nordic Ct
- 612 S Butterfield Rd
- 1132 Crestfield Ave
- 1126 Crestfield Ave
- 635 Nordic Ct
- 1120 Crestfield Ave
- 629 Nordic Ct
- 610 S Butterfield Rd
- 637 Nordic Ct
- 1114 Crestfield Ave
- 627 Nordic Ct
- 634 Nordic Ct
- 639 Nordic Ct
- 1108 Crestfield Ave
- 1201 Canterbury Cir
- 611 S Butterfield Rd
- 1131 Crestfield Ave