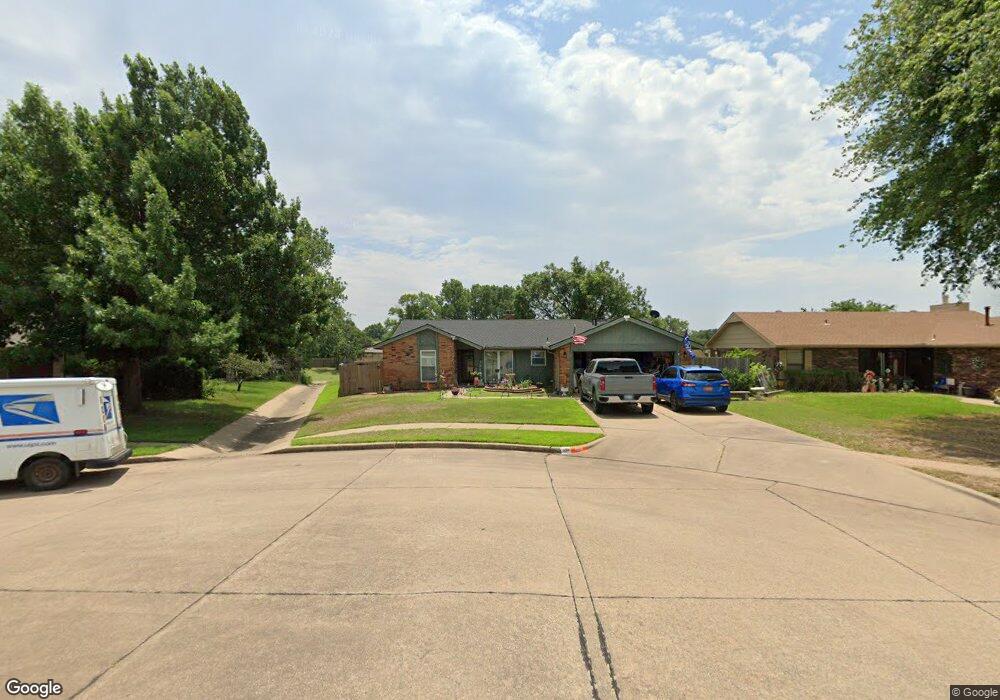
620 Shannon Rd Ponca City, OK 74601
Estimated Value: $174,677 - $188,000
3
Beds
2
Baths
1,480
Sq Ft
$121/Sq Ft
Est. Value
About This Home
This home is located at 620 Shannon Rd, Ponca City, OK 74601 and is currently estimated at $179,669, approximately $121 per square foot. 620 Shannon Rd is a home located in Kay County with nearby schools including Union Elementary School, Ponca City East Middle School, and Ponca City West Middle School.
Ownership History
Date
Name
Owned For
Owner Type
Purchase Details
Closed on
Nov 12, 2019
Sold by
Korklan Lorraine Traynor and Korklan Jeffrey H
Bought by
Harkins Todd H and Harkins Shawn L
Current Estimated Value
Home Financials for this Owner
Home Financials are based on the most recent Mortgage that was taken out on this home.
Original Mortgage
$130,099
Outstanding Balance
$114,567
Interest Rate
3.65%
Mortgage Type
FHA
Estimated Equity
$65,102
Purchase Details
Closed on
Oct 2, 2009
Sold by
Brewer Chance B
Bought by
Traynor Jack R
Home Financials for this Owner
Home Financials are based on the most recent Mortgage that was taken out on this home.
Original Mortgage
$60,000
Interest Rate
5.1%
Mortgage Type
New Conventional
Purchase Details
Closed on
Aug 27, 2004
Sold by
Helen Rajesh and Helen Patel
Bought by
Chance Brewer
Purchase Details
Closed on
Dec 9, 1998
Sold by
Katherine and Seitsinger D
Bought by
Helen Rajesh and Helen Patel
Create a Home Valuation Report for This Property
The Home Valuation Report is an in-depth analysis detailing your home's value as well as a comparison with similar homes in the area
Home Values in the Area
Average Home Value in this Area
Purchase History
| Date | Buyer | Sale Price | Title Company |
|---|---|---|---|
| Harkins Todd H | $132,500 | Stewart Title Guaranty Co | |
| Traynor Jack R | $114,900 | -- | |
| Chance Brewer | $111,000 | -- | |
| Helen Rajesh | $73,500 | -- |
Source: Public Records
Mortgage History
| Date | Status | Borrower | Loan Amount |
|---|---|---|---|
| Open | Harkins Todd H | $130,099 | |
| Previous Owner | Traynor Jack R | $60,000 |
Source: Public Records
Tax History Compared to Growth
Tax History
| Year | Tax Paid | Tax Assessment Tax Assessment Total Assessment is a certain percentage of the fair market value that is determined by local assessors to be the total taxable value of land and additions on the property. | Land | Improvement |
|---|---|---|---|---|
| 2024 | $1,369 | $15,462 | $1,392 | $14,070 |
| 2023 | $1,369 | $15,012 | $1,392 | $13,620 |
| 2022 | $1,292 | $14,575 | $1,950 | $12,625 |
| 2021 | $1,298 | $14,575 | $1,950 | $12,625 |
| 2020 | $1,285 | $14,575 | $1,950 | $12,625 |
| 2019 | $1,138 | $11,908 | $1,392 | $10,516 |
| 2018 | $1,179 | $12,176 | $1,392 | $10,784 |
| 2017 | $1,125 | $12,475 | $1,392 | $11,083 |
| 2016 | $1,151 | $12,625 | $1,392 | $11,233 |
| 2015 | $1,143 | $12,493 | $1,392 | $11,101 |
| 2014 | $1,102 | $12,288 | $1,392 | $10,896 |
Source: Public Records
Map
Nearby Homes
- 1009 Brentwood Dr
- TBD 5th and Windsor
- 120 E Woodbury Rd
- 3651 N 14th St
- 2000 N 5th St
- 2005 N 4th St
- 0000 N Union St
- 3019 Meadow Ln
- 1704 Fairway Place
- 3013 Kingston Rd
- 1703 Leslie Ln
- 3205 Kingston Rd
- 1128 N 14th St
- 3602 N 14th
- 1412 Donahoe Dr
- 2223 Turner St
- 2117 Ashley Place
- 2023 Turner St
- 1600 Monument Rd
- 2208 El Camino St
- 616 Shannon Rd
- 624 Shannon Rd
- 612 Shannon Rd
- 628 Shannon Rd
- 608 Shannon Rd
- 804 Greenbriar Rd
- 813 Greenbriar Rd
- 613 Shannon Rd
- 2503 Windsor Rd
- 2505 Windsor Rd
- 604 Shannon Rd
- 2501 Windsor Rd
- 609 Shannon Rd
- 809 Greenbriar Rd
- 1105 Brentwood Dr
- 2507 Windsor Rd
- 1101 Brentwood Dr
- 1109 Brentwood Dr
- 1029 Brentwood Dr
- 605 Shannon Rd