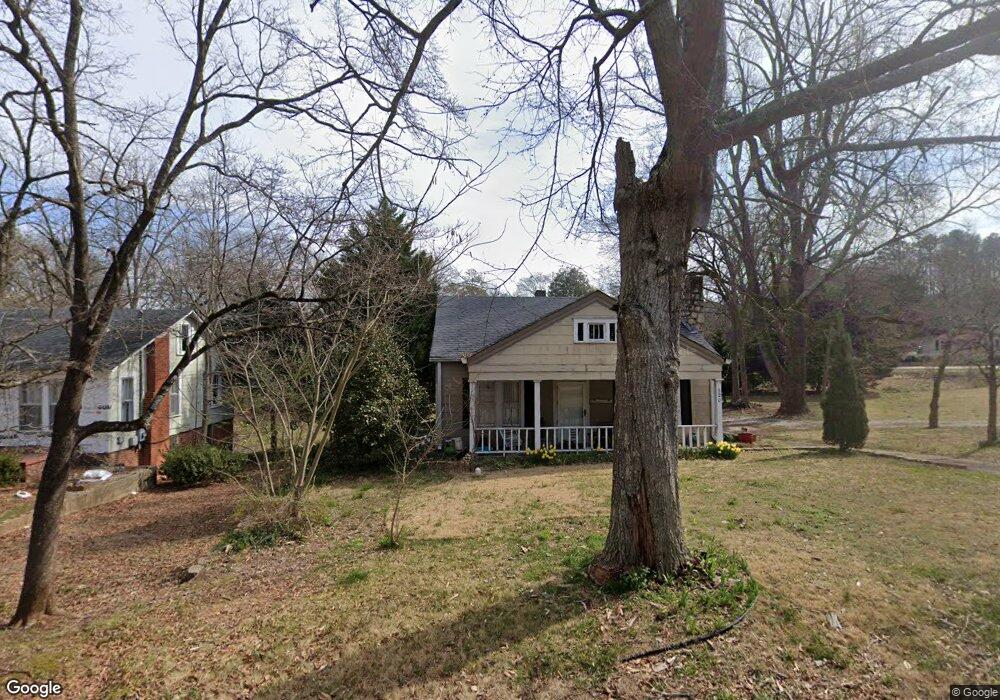
620 Spring St Villa Rica, GA 30180
Estimated Value: $156,000 - $218,000
2
Beds
1
Bath
1,540
Sq Ft
$127/Sq Ft
Est. Value
About This Home
This home is located at 620 Spring St, Villa Rica, GA 30180 and is currently estimated at $195,619, approximately $127 per square foot. 620 Spring St is a home located in Carroll County with nearby schools including Villa Rica Elementary School, Villa Rica Middle School, and Villa Rica High School.
Ownership History
Date
Name
Owned For
Owner Type
Purchase Details
Closed on
Nov 20, 2009
Sold by
Federal National Mortgage Association
Bought by
Bonds Autumn
Current Estimated Value
Home Financials for this Owner
Home Financials are based on the most recent Mortgage that was taken out on this home.
Original Mortgage
$54,003
Outstanding Balance
$35,226
Interest Rate
4.98%
Mortgage Type
FHA
Estimated Equity
$160,393
Purchase Details
Closed on
Jul 7, 2009
Sold by
Jp Morgan Chase Bank Natio
Bought by
Federal National Mtg Associati
Purchase Details
Closed on
Jun 30, 2005
Sold by
Mayfield Jere J
Bought by
Moore Michael A
Purchase Details
Closed on
Sep 11, 2001
Sold by
Thompson Heather D
Bought by
Mayfield Jere J
Purchase Details
Closed on
Aug 10, 2001
Sold by
Thompson Delmer E
Bought by
Thompson Heather D
Purchase Details
Closed on
Feb 18, 1993
Bought by
Thompson
Create a Home Valuation Report for This Property
The Home Valuation Report is an in-depth analysis detailing your home's value as well as a comparison with similar homes in the area
Home Values in the Area
Average Home Value in this Area
Purchase History
| Date | Buyer | Sale Price | Title Company |
|---|---|---|---|
| Bonds Autumn | $55,000 | -- | |
| Federal National Mtg Associati | $104,736 | -- | |
| Jp Morgan Chase Bank National | $104,736 | -- | |
| Moore Michael A | $98,500 | -- | |
| Mayfield Jere J | $69,900 | -- | |
| Thompson Heather D | -- | -- | |
| Thompson | $38,000 | -- |
Source: Public Records
Mortgage History
| Date | Status | Borrower | Loan Amount |
|---|---|---|---|
| Open | Jp Morgan Chase Bank National | $54,003 |
Source: Public Records
Tax History Compared to Growth
Tax History
| Year | Tax Paid | Tax Assessment Tax Assessment Total Assessment is a certain percentage of the fair market value that is determined by local assessors to be the total taxable value of land and additions on the property. | Land | Improvement |
|---|---|---|---|---|
| 2024 | $1,289 | $56,748 | $14,985 | $41,763 |
| 2023 | $1,289 | $52,869 | $14,985 | $37,884 |
| 2022 | $1,026 | $40,426 | $9,990 | $30,436 |
| 2021 | $878 | $33,533 | $7,400 | $26,133 |
| 2020 | $816 | $30,950 | $7,400 | $23,550 |
| 2019 | $752 | $28,739 | $7,400 | $21,339 |
| 2018 | $715 | $26,554 | $7,400 | $19,154 |
| 2017 | $725 | $26,554 | $7,400 | $19,154 |
| 2016 | $729 | $26,554 | $7,400 | $19,154 |
| 2015 | $645 | $21,965 | $8,000 | $13,966 |
| 2014 | $650 | $21,966 | $8,000 | $13,966 |
Source: Public Records
Map
Nearby Homes
- Peachwood Plan at The Fairways at Mirror Lake
- Auburn Tandem Plan at The Fairways at Mirror Lake
- Bedford Tandem Plan at The Fairways at Mirror Lake
- Westwind Tandem Plan at The Fairways at Mirror Lake
- Montrose Plan at The Fairways at Mirror Lake
- Woodbury Plan at The Fairways at Mirror Lake
- Westwind Plan at The Fairways at Mirror Lake
- Bedford Plan at The Fairways at Mirror Lake
- Auburn Plan at The Fairways at Mirror Lake
- Kathleen Plan at The Fairways at Mirror Lake
- 232 S Candler St
- 209 E Wilson St
- 160 Alton Cir
- 1385 Georgia 61
- 1395 Georgia 61
- 220 Bastian Dr
- 220 Bastian Dr Unit 114
- 0 Edge Rd Unit 10526958
- 0 S Farms Edge Rd Unit 10563946
- 0 S Farms Edge Rd Unit 1654481
- 618 Spring St
- 251 S Carroll Rd
- 259 S Carroll Rd
- 0 Spring St Unit 7167883
- 0 Spring St Unit 7142337
- 0 Spring St Unit 8715739
- 0 Spring St Unit 8726016
- 0 Spring St Unit 8632482
- 0 Spring St Unit 8548707
- 0 Spring St Unit 8439061
- 0 Spring St Unit 8403534
- 0 Spring St Unit 8144897
- 0 Spring St Unit 7401329
- 0 Spring St Unit 3193475
- 0 Spring St Unit 7217711
- 0 Spring St Unit 7570432
- 0 Spring St Unit 7304701
- 0 Spring St Unit 8254638
- 0 Spring St Unit 7247918
- 0 Spring St Unit 7537554