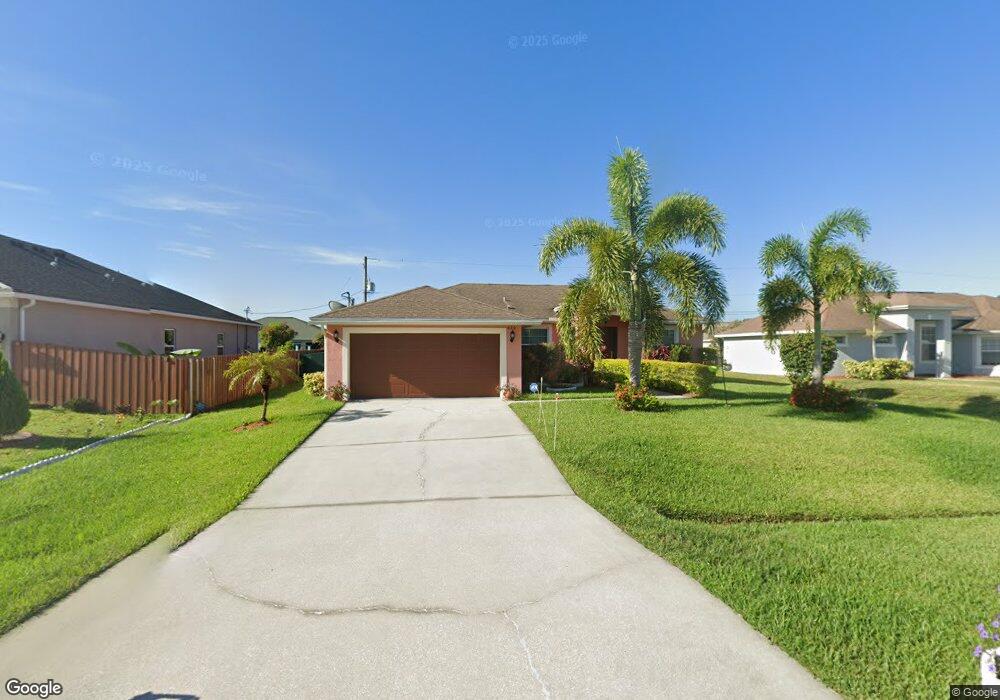
620 SW Hamberland Ave Port Saint Lucie, FL 34953
Crane Landing NeighborhoodEstimated Value: $366,585 - $391,000
3
Beds
2
Baths
1,562
Sq Ft
$244/Sq Ft
Est. Value
About This Home
This home is located at 620 SW Hamberland Ave, Port Saint Lucie, FL 34953 and is currently estimated at $381,396, approximately $244 per square foot. 620 SW Hamberland Ave is a home located in St. Lucie County with nearby schools including Windmill Point Elementary School, Oak Hammock K-8 School, and Bayshore Elementary School.
Ownership History
Date
Name
Owned For
Owner Type
Purchase Details
Closed on
Jan 13, 2010
Sold by
Hsbc Bank Usa National Association
Bought by
Sherman Lee
Current Estimated Value
Home Financials for this Owner
Home Financials are based on the most recent Mortgage that was taken out on this home.
Original Mortgage
$76,800
Interest Rate
4.97%
Mortgage Type
New Conventional
Purchase Details
Closed on
Sep 21, 2009
Sold by
Jurado Alexandra and Perez Camilo
Bought by
Hsbc Bank Usa National Association
Purchase Details
Closed on
Apr 28, 2006
Sold by
Quesada Richard
Bought by
Perez Camilo and Jurado Alexandra
Home Financials for this Owner
Home Financials are based on the most recent Mortgage that was taken out on this home.
Original Mortgage
$216,000
Interest Rate
7.8%
Mortgage Type
Balloon
Purchase Details
Closed on
Apr 25, 2005
Sold by
Cannady Raymond
Bought by
Quesada Richard
Purchase Details
Closed on
Jul 15, 2003
Sold by
Cordero Raul
Bought by
Gomez Mayte
Create a Home Valuation Report for This Property
The Home Valuation Report is an in-depth analysis detailing your home's value as well as a comparison with similar homes in the area
Home Values in the Area
Average Home Value in this Area
Purchase History
| Date | Buyer | Sale Price | Title Company |
|---|---|---|---|
| Sherman Lee | $96,000 | Southern Fincl Title Svcs | |
| Hsbc Bank Usa National Association | -- | Attorney | |
| Perez Camilo | $270,000 | Attorney | |
| Quesada Richard | $77,000 | -- | |
| Gomez Mayte | -- | -- |
Source: Public Records
Mortgage History
| Date | Status | Borrower | Loan Amount |
|---|---|---|---|
| Previous Owner | Sherman Lee | $76,800 | |
| Previous Owner | Perez Camilo | $216,000 |
Source: Public Records
Tax History Compared to Growth
Tax History
| Year | Tax Paid | Tax Assessment Tax Assessment Total Assessment is a certain percentage of the fair market value that is determined by local assessors to be the total taxable value of land and additions on the property. | Land | Improvement |
|---|---|---|---|---|
| 2024 | $1,884 | $114,386 | -- | -- |
| 2023 | $1,884 | $111,055 | $0 | $0 |
| 2022 | $1,865 | $107,821 | $0 | $0 |
| 2021 | $1,754 | $104,681 | $0 | $0 |
| 2020 | $1,722 | $102,250 | $0 | $0 |
| 2019 | $1,690 | $99,952 | $0 | $0 |
| 2018 | $1,584 | $98,089 | $0 | $0 |
| 2017 | $1,556 | $148,700 | $28,000 | $120,700 |
| 2016 | $1,528 | $134,900 | $24,000 | $110,900 |
| 2015 | $1,539 | $103,800 | $14,400 | $89,400 |
| 2014 | $1,470 | $92,700 | $0 | $0 |
Source: Public Records
Map
Nearby Homes
- 729 SW Haas Ave
- 590 SW Lacroix Ave
- 4123 SW Port St Lucie Blvd
- 4232 SW Jame St
- 684 SW Jada Rd
- 672 SW Kayak Ave
- 4091 SW Port St Lucie Blvd
- 540 SW Rabbit Ave
- 4249 SW Port St Lucie Blvd
- 541 SW Nadell Ct
- 4222 SW Port Saint Lucie Blvd
- 4232 SW Port Saint Lucie Blvd
- 4273 SW Port St Lucie Blvd
- 4049 SW Port Saint Lucie Blvd
- 4292 SW Whitebread Rd
- 543 SW Kabot Ave
- 590 SW Jeanne Ave
- 3990 SW Halcomb St
- 514 SW Kabot Ave
- 873 SW Kappa Ave
- 638 SW Hamberland Ave
- 602 SW Hamberland Ave
- 619 SW Haas Ave
- 601 SW Haas Ave
- 656 SW Hamberland Ave
- 655 SW Haas Ave
- 619 SW Hamberland Ave
- 601 SW Hamberland Ave
- 637 SW Hamberland Ave
- 674 SW Hamberland Ave
- 4181 SW Mccrory St
- 4171 SW Mccrory St
- 655 SW Hamberland Ave
- 673 SW Haas Ave
- 4199 SW Mccrory St
- 4191 SW Mccrory St
- 673 SW Hamberland Ave
- 602 SW Haas Ave
- 638 SW Haas Ave
- 4151 SW Mccrory St