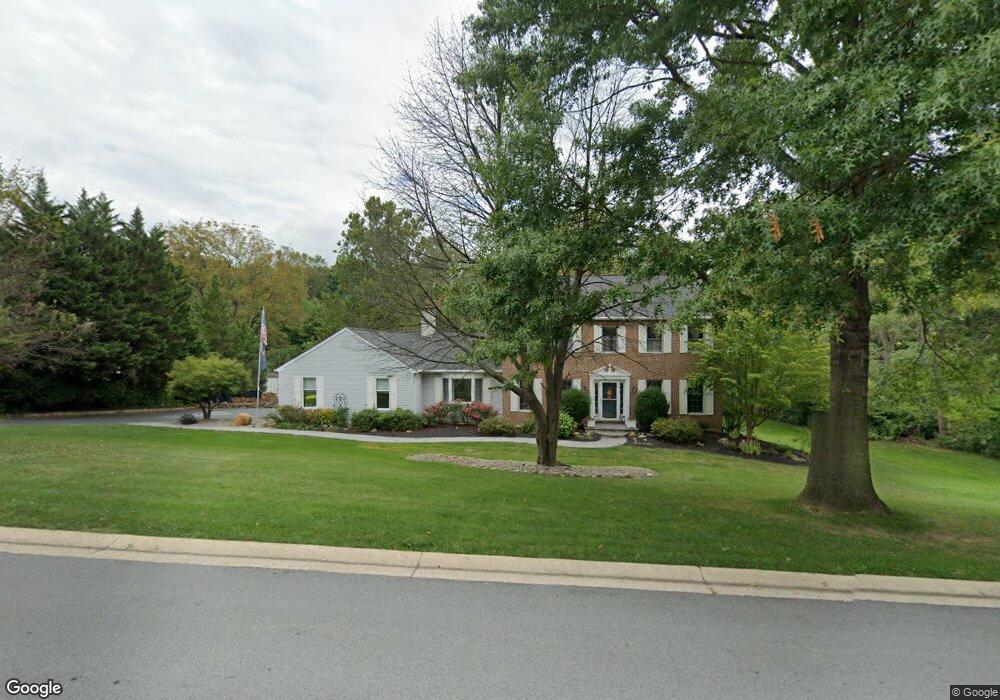
620 Waterfall Way Phoenixville, PA 19460
Estimated Value: $767,000 - $807,000
4
Beds
3
Baths
3,040
Sq Ft
$259/Sq Ft
Est. Value
About This Home
This home is located at 620 Waterfall Way, Phoenixville, PA 19460 and is currently estimated at $787,348, approximately $258 per square foot. 620 Waterfall Way is a home located in Chester County with nearby schools including Phoenixville Area Middle School, Phoenixville Area High School, and Renaissance Academy.
Ownership History
Date
Name
Owned For
Owner Type
Purchase Details
Closed on
Apr 10, 2010
Sold by
National Transfer Services Llc
Bought by
Urbanski Ronald E and Urbanski Kristen A
Current Estimated Value
Home Financials for this Owner
Home Financials are based on the most recent Mortgage that was taken out on this home.
Original Mortgage
$260,000
Outstanding Balance
$173,083
Interest Rate
4.99%
Mortgage Type
New Conventional
Estimated Equity
$614,265
Purchase Details
Closed on
Jan 30, 2010
Sold by
Belsky Kimberly A and Bolles David A
Bought by
National Transfer Services Llc and Mobility Services International Llc
Purchase Details
Closed on
Dec 30, 1994
Sold by
Scofield James R and Scofield Christine M
Bought by
Newman Edward M and Newman Robin L
Home Financials for this Owner
Home Financials are based on the most recent Mortgage that was taken out on this home.
Original Mortgage
$228,850
Interest Rate
8.5%
Create a Home Valuation Report for This Property
The Home Valuation Report is an in-depth analysis detailing your home's value as well as a comparison with similar homes in the area
Home Values in the Area
Average Home Value in this Area
Purchase History
| Date | Buyer | Sale Price | Title Company |
|---|---|---|---|
| Urbanski Ronald E | $385,000 | None Available | |
| National Transfer Services Llc | $385,000 | None Available | |
| Newman Edward M | $240,900 | -- |
Source: Public Records
Mortgage History
| Date | Status | Borrower | Loan Amount |
|---|---|---|---|
| Open | Urbanski Ronald E | $260,000 | |
| Previous Owner | Newman Edward M | $228,850 |
Source: Public Records
Tax History Compared to Growth
Tax History
| Year | Tax Paid | Tax Assessment Tax Assessment Total Assessment is a certain percentage of the fair market value that is determined by local assessors to be the total taxable value of land and additions on the property. | Land | Improvement |
|---|---|---|---|---|
| 2025 | $9,397 | $249,000 | $47,250 | $201,750 |
| 2024 | $9,397 | $249,000 | $47,250 | $201,750 |
| 2023 | $9,300 | $249,000 | $47,250 | $201,750 |
| 2022 | $8,268 | $222,920 | $47,250 | $175,670 |
| 2021 | $8,157 | $222,920 | $47,250 | $175,670 |
| 2020 | $7,978 | $222,920 | $47,250 | $175,670 |
| 2019 | $7,827 | $222,920 | $47,250 | $175,670 |
| 2018 | $7,666 | $222,920 | $47,250 | $175,670 |
| 2017 | $7,472 | $219,970 | $47,250 | $172,720 |
| 2016 | $1,000 | $219,970 | $47,250 | $172,720 |
| 2015 | $1,000 | $219,970 | $47,250 | $172,720 |
| 2014 | $1,000 | $219,970 | $47,250 | $172,720 |
Source: Public Records
Map
Nearby Homes
- 138 Camp Council Rd
- 1018 Hares Hill Rd
- 2006 Diane Cir
- 1049 Mowere Rd
- 412 Thistle Dr
- 103 Jay Ave
- 1029 Snyder Ave
- 651 Schuylkill Rd
- 1035 Snyder Ave
- 725 Reading Cir
- 1203 Durham Ct Unit 47
- 1408 Black Walnut Dr Unit 1408
- 131 Violet Way
- 325 Westridge Cir Unit T141
- 3003 Spice Way
- 111 Potters Pond Dr Unit 33
- 212 Hill Church Rd
- 2404 Northridge Ct
- 910 Township Line Rd
- 180 Chester Ave
- 618 Waterfall Way
- 900 Rebecca Dr
- 902 Rebecca Dr
- 613 Waterfall Way
- 611 Waterfall Way
- 617 Waterfall Way
- 609 Waterfall Way
- 901 Rebecca Dr
- 904 Rebecca Dr
- 616 Waterfall Way
- 614 Waterfall Way
- 149 Silver Springs Rd
- 903 Rebecca Dr
- 619 Waterfall Way
- 151 Silver Springs Rd
- 702 Creekview Cir
- 622 Waterfall Way
- 612 Waterfall Way
- 905 Rebecca Dr
- 153 Silver Springs Rd