Estimated Value: $270,875 - $281,000
3
Beds
2
Baths
1,993
Sq Ft
$139/Sq Ft
Est. Value
About This Home
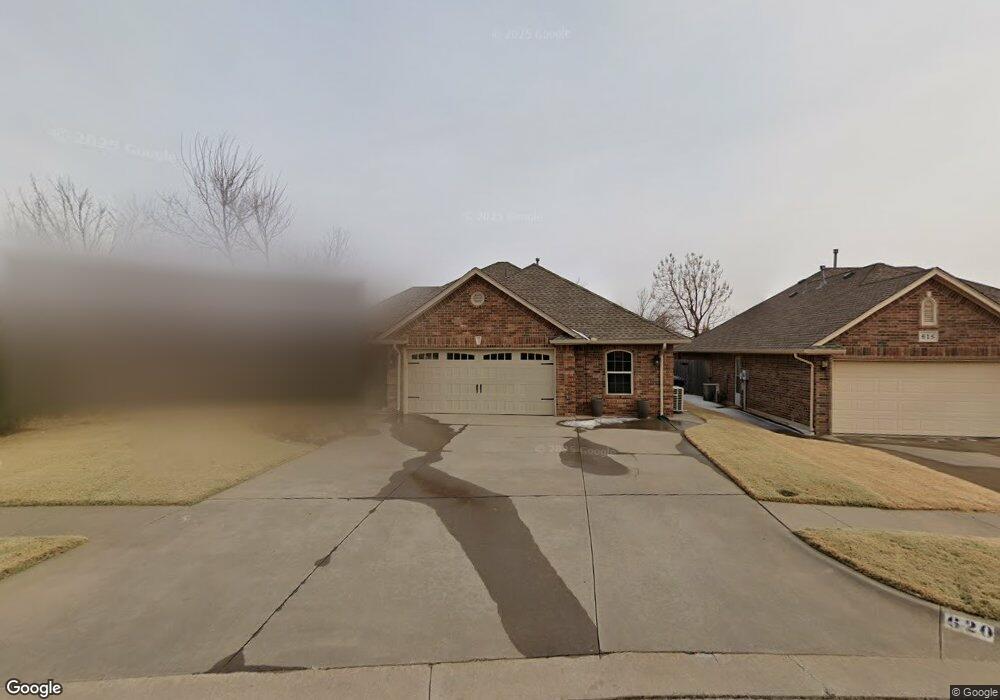
This home is located at 620 Wicket Place, Yukon, OK 73099 and is currently estimated at $276,719, approximately $138 per square foot. 620 Wicket Place is a home located in Canadian County with nearby schools including Parkland Elementary School, Independence Elementary School, and Yukon Middle School.
Ownership History
Date
Name
Owned For
Owner Type
Purchase Details
Closed on
Sep 2, 2015
Sold by
Robison Joseph
Bought by
Swanson Haley and Swanson Christopher
Current Estimated Value
Home Financials for this Owner
Home Financials are based on the most recent Mortgage that was taken out on this home.
Original Mortgage
$159,900
Outstanding Balance
$126,103
Interest Rate
4.03%
Estimated Equity
$150,616
Purchase Details
Closed on
Jan 5, 2015
Sold by
The Bank Of New York Mellon
Bought by
Robison Joseph
Purchase Details
Closed on
Oct 20, 2014
Sold by
Tallant Demetra A
Bought by
The Bank Of New York Mellon
Purchase Details
Closed on
Sep 21, 1999
Sold by
Dominion Homes Inc
Purchase Details
Closed on
Mar 15, 1999
Sold by
Shelton Fine Homes Inc
Purchase Details
Closed on
May 12, 1998
Sold by
Drakestone Corp
Create a Home Valuation Report for This Property
The Home Valuation Report is an in-depth analysis detailing your home's value as well as a comparison with similar homes in the area
Home Values in the Area
Average Home Value in this Area
Purchase History
| Date | Buyer | Sale Price | Title Company |
|---|---|---|---|
| Swanson Haley | $170,000 | American Eagle Title Group | |
| Robison Joseph | $143,500 | Oklahoma Title & Closing Co | |
| The Bank Of New York Mellon | $130,000 | None Available | |
| -- | $127,000 | -- | |
| -- | $154,000 | -- | |
| -- | $15,500 | -- |
Source: Public Records
Mortgage History
| Date | Status | Borrower | Loan Amount |
|---|---|---|---|
| Open | Swanson Haley | $159,900 |
Source: Public Records
Tax History Compared to Growth
Tax History
| Year | Tax Paid | Tax Assessment Tax Assessment Total Assessment is a certain percentage of the fair market value that is determined by local assessors to be the total taxable value of land and additions on the property. | Land | Improvement |
|---|---|---|---|---|
| 2024 | $2,601 | $23,282 | $2,160 | $21,122 |
| 2023 | $2,601 | $22,604 | $2,160 | $20,444 |
| 2022 | $2,537 | $21,945 | $2,160 | $19,785 |
| 2021 | $2,447 | $21,306 | $2,160 | $19,146 |
| 2020 | $2,353 | $20,686 | $2,160 | $18,526 |
| 2019 | $2,282 | $20,083 | $2,160 | $17,923 |
| 2018 | $2,214 | $19,499 | $2,160 | $17,339 |
| 2017 | $2,236 | $19,761 | $2,160 | $17,601 |
| 2016 | $2,255 | $19,962 | $2,160 | $17,802 |
| 2015 | $2,443 | $20,275 | $2,160 | $18,115 |
| 2014 | $2,443 | $20,467 | $2,160 | $18,307 |
Source: Public Records
Map
Nearby Homes
- 11608 NW 6th St
- 713 Vickery Ave
- 717 Vickery Ave
- 11713 NW 6th St
- 612 Ellsworth Ave
- 801 Dana Dr
- 310 Glen Dr
- 309 Glen Dr
- 11817 Hollyrock Dr
- 12177 Hollyrock Dr
- 2229 Rockbridge Ct
- 2216 Stone Mill Ct
- 12113 NW 7th St
- 2404 Big Horn Canyon Rd
- 11741 Oakdale St
- 712 Bobcat Trail
- 624 Caladium Dr
- 320 E Meade Dr
- 316 E Meade Dr
- 2101 Rockrun Mill
- 616 Wicket Place
- 624 Wicket Place
- 625 Vickery Ave
- 612 Wicket Place
- 621 Vickery Ave
- 629 Vickery Ave
- 11700 NW 6th St
- 617 Vickery Ave
- 608 Wicket Place
- 633 Vickery Ave
- 625 Wicket Place
- 613 Vickery Ave
- 11704 NW 6th St
- 637 Vickery Ave
- 11621 NW 6th St
- 12624 NW 3rd St
- 12600 NW 3rd St
- 12616 NW 3rd St
- 12620 NW 3rd St
- 12612 NW 3rd St