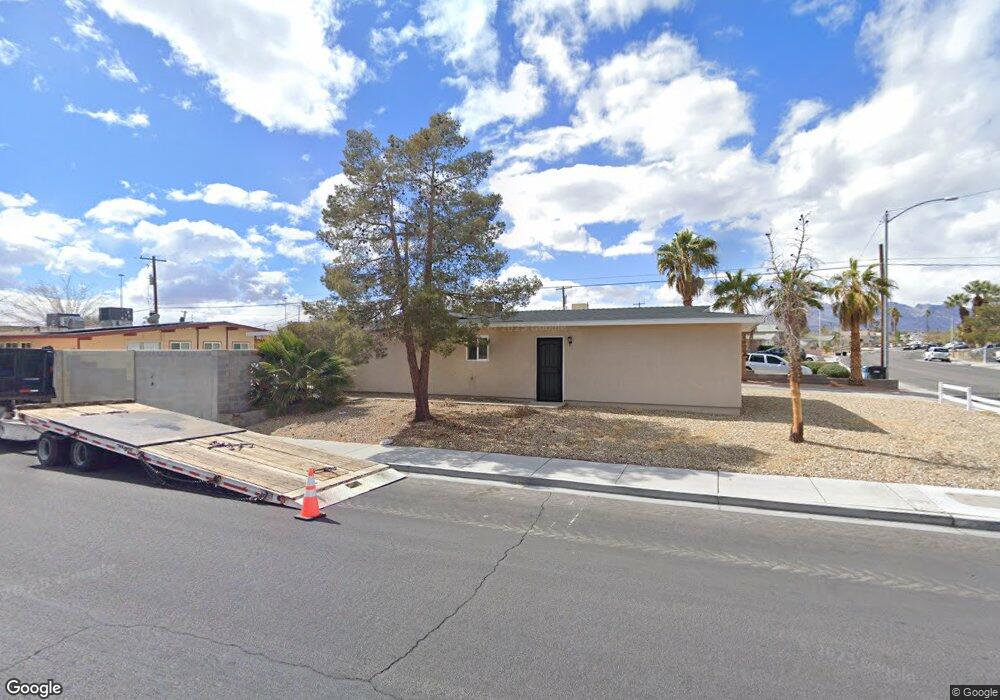
6201 Parsifal Place Las Vegas, NV 89107
Pittman NeighborhoodEstimated Value: $344,015 - $353,000
3
Beds
2
Baths
1,180
Sq Ft
$296/Sq Ft
Est. Value
About This Home
This home is located at 6201 Parsifal Place, Las Vegas, NV 89107 and is currently estimated at $349,254, approximately $295 per square foot. 6201 Parsifal Place is a home located in Clark County with nearby schools including Vail Pittman Elementary School, Frank F Garside Junior High School, and Western High School.
Ownership History
Date
Name
Owned For
Owner Type
Purchase Details
Closed on
Jul 13, 2023
Sold by
J C B-Vegas 13 Llc
Bought by
Molina Mario E
Current Estimated Value
Home Financials for this Owner
Home Financials are based on the most recent Mortgage that was taken out on this home.
Original Mortgage
$288,000
Outstanding Balance
$280,975
Interest Rate
6.67%
Mortgage Type
New Conventional
Estimated Equity
$68,279
Purchase Details
Closed on
Jan 10, 2011
Sold by
Burg Jean Claude and Burg Marie France
Bought by
Jcb Vegas 13 Llc
Purchase Details
Closed on
Sep 29, 2009
Sold by
Burg Jean Claude
Bought by
Burg Jean Claude and Burg Marie France
Purchase Details
Closed on
Sep 23, 2009
Sold by
Leavitt George B
Bought by
Leavitt Debra Sue
Purchase Details
Closed on
Sep 22, 2009
Sold by
Horton Dora L and Leavitt Debra Sue
Bought by
Burg Jean Claude
Purchase Details
Closed on
Sep 14, 1995
Sold by
Horton Charlie Richard
Bought by
Horton Dora L and Leavitt Debra Sue
Create a Home Valuation Report for This Property
The Home Valuation Report is an in-depth analysis detailing your home's value as well as a comparison with similar homes in the area
Home Values in the Area
Average Home Value in this Area
Purchase History
| Date | Buyer | Sale Price | Title Company |
|---|---|---|---|
| Molina Mario E | $320,000 | Fidelity National Title | |
| Jcb Vegas 13 Llc | $52,000 | None Available | |
| Burg Jean Claude | -- | None Available | |
| Leavitt Debra Sue | -- | First American Title Paseo V | |
| Burg Jean Claude | $52,000 | First American Title Paseo V | |
| Horton Dora L | -- | -- |
Source: Public Records
Mortgage History
| Date | Status | Borrower | Loan Amount |
|---|---|---|---|
| Open | Molina Mario E | $288,000 |
Source: Public Records
Tax History Compared to Growth
Tax History
| Year | Tax Paid | Tax Assessment Tax Assessment Total Assessment is a certain percentage of the fair market value that is determined by local assessors to be the total taxable value of land and additions on the property. | Land | Improvement |
|---|---|---|---|---|
| 2025 | $894 | $47,411 | $29,750 | $17,661 |
| 2024 | $828 | $47,411 | $29,750 | $17,661 |
| 2023 | $828 | $47,045 | $31,150 | $15,895 |
| 2022 | $767 | $40,488 | $26,250 | $14,238 |
| 2021 | $711 | $37,017 | $23,800 | $13,217 |
| 2020 | $657 | $34,195 | $21,350 | $12,845 |
| 2019 | $616 | $30,252 | $17,850 | $12,402 |
| 2018 | $588 | $26,705 | $15,050 | $11,655 |
| 2017 | $872 | $26,597 | $15,050 | $11,547 |
| 2016 | $551 | $22,349 | $11,200 | $11,149 |
| 2015 | $549 | $19,916 | $9,100 | $10,816 |
| 2014 | $532 | $15,740 | $5,250 | $10,490 |
Source: Public Records
Map
Nearby Homes
- 6112 Denver Cir
- 6121 Fawn Cir
- 6100 Fawn Cir
- 6244 Rassler Ave
- 704 N Wallace Dr
- 6261 Rassler Ave
- 6224 Fargo Ave
- 5924 Iris Ave
- 304 Orland St Unit 53
- 304 Orland St Unit 56
- 304 Orland St Unit 39
- 304 Orland St Unit 38
- 304 Orland St Unit 47
- 304 Orland St Unit 43
- 212 Orland St Unit 23
- 212 Orland St Unit 28
- 212 Orland St Unit 22
- 212 Orland St Unit 19
- 212 Orland St Unit 17
- 208 Orland St Unit 10
- 6201 Parsifal Place Unit N
- 6200 Lawton Ave
- 6204 Lawton Ave
- 6209 Parsifal Place
- 228 N Wallace Dr
- 224 N Wallace Dr
- 232 N Wallace Dr
- 6200 Parsifal Place
- 6208 Lawton Ave
- 220 N Wallace Dr
- 6213 Parsifal Place
- 300 N Wallace Dr
- 6212 Lawton Ave
- 6208 Parsifal Place
- 6208 Parsifal Place Unit na
- 304 N Wallace Dr
- 216 N Wallace Dr
- 6124 Chelsea Cir
- 6125 Denver Cir
- 6217 Parsifal Place