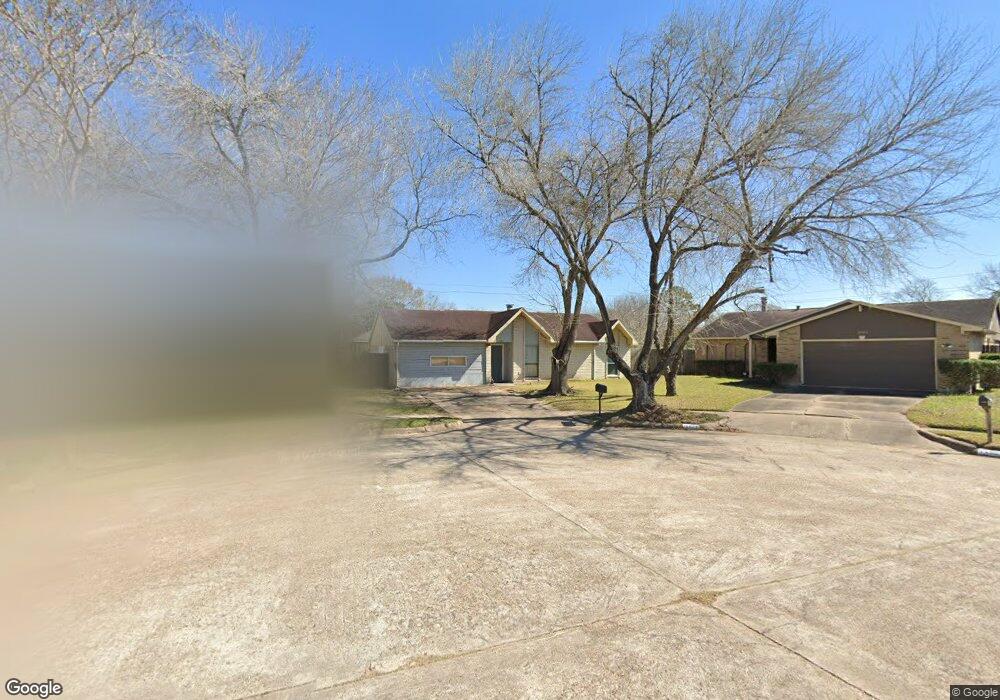
6202 Briar Seasons Dr Missouri City, TX 77489
Fort Bend Houston NeighborhoodEstimated Value: $220,000 - $230,879
3
Beds
2
Baths
1,719
Sq Ft
$132/Sq Ft
Est. Value
About This Home
This home is located at 6202 Briar Seasons Dr, Missouri City, TX 77489 and is currently estimated at $226,220, approximately $131 per square foot. 6202 Briar Seasons Dr is a home located in Fort Bend County with nearby schools including Briargate Elementary School, Blue Ridge Elementary School, and Christa McAuliffe Middle School.
Ownership History
Date
Name
Owned For
Owner Type
Purchase Details
Closed on
Sep 1, 2016
Sold by
Homes Quick Lp
Bought by
Bonilla Jose F Hernandez
Current Estimated Value
Home Financials for this Owner
Home Financials are based on the most recent Mortgage that was taken out on this home.
Original Mortgage
$123,900
Outstanding Balance
$99,062
Interest Rate
3.46%
Mortgage Type
Purchase Money Mortgage
Estimated Equity
$127,158
Purchase Details
Closed on
Jun 13, 2014
Sold by
Us Bank Trust Na
Bought by
Homes Quick Lp
Purchase Details
Closed on
Mar 12, 2014
Sold by
Henderson Cynthia D
Bought by
Us Bank Trust Na
Purchase Details
Closed on
Jun 27, 2000
Sold by
Jan Adell Bacon
Bought by
Henderson Cynthia D
Home Financials for this Owner
Home Financials are based on the most recent Mortgage that was taken out on this home.
Original Mortgage
$69,500
Interest Rate
8.66%
Create a Home Valuation Report for This Property
The Home Valuation Report is an in-depth analysis detailing your home's value as well as a comparison with similar homes in the area
Home Values in the Area
Average Home Value in this Area
Purchase History
| Date | Buyer | Sale Price | Title Company |
|---|---|---|---|
| Bonilla Jose F Hernandez | -- | None Available | |
| Bonilla Jose F Hernandez | -- | -- | |
| Homes Quick Lp | -- | First American Title | |
| Bonilla Jose F Hernandez | -- | -- | |
| Us Bank Trust Na | $72,789 | None Available | |
| Bonilla Jose F Hernandez | -- | -- | |
| Henderson Cynthia D | -- | Fidelity National Title |
Source: Public Records
Mortgage History
| Date | Status | Borrower | Loan Amount |
|---|---|---|---|
| Open | Bonilla Jose F Hernandez | $123,900 | |
| Previous Owner | Henderson Cynthia D | $69,500 |
Source: Public Records
Tax History Compared to Growth
Tax History
| Year | Tax Paid | Tax Assessment Tax Assessment Total Assessment is a certain percentage of the fair market value that is determined by local assessors to be the total taxable value of land and additions on the property. | Land | Improvement |
|---|---|---|---|---|
| 2025 | $4,802 | $228,800 | $84,906 | $143,894 |
| 2024 | $4,802 | $249,063 | $84,906 | $164,157 |
| 2023 | $4,851 | $249,117 | $65,313 | $183,804 |
| 2022 | $4,555 | $214,920 | $43,940 | $170,980 |
| 2021 | $3,440 | $155,380 | $29,690 | $125,690 |
| 2020 | $3,114 | $138,080 | $29,690 | $108,390 |
| 2019 | $3,334 | $140,550 | $29,690 | $110,860 |
| 2018 | $2,879 | $121,320 | $20,900 | $100,420 |
| 2017 | $2,678 | $111,550 | $20,900 | $90,650 |
| 2016 | $2,454 | $102,250 | $20,900 | $81,350 |
| 2015 | $1,661 | $90,940 | $20,900 | $70,040 |
| 2014 | $800 | $57,660 | $20,900 | $36,760 |
Source: Public Records
Map
Nearby Homes
- 15806 Corsair Rd
- 6101 Maywood Dr
- 15610 Briar Spring Ct
- 15318 Corsair Rd
- 15734 Briargate Ct
- 15615 Raven Trail
- 15770 Chimney Rock Rd
- 5710 W Ridgecreek Dr
- 5734 Arthington St
- 5774 Gineridge Dr
- 6618 Castleview Ln
- 5614 Condon Ln
- 15903 Lenclaire Dr
- 15823 Kueben Ln
- 16210 Rosenridge Dr
- 6619 Indian Lake Dr
- 5605 Melanite Ave
- 6018 Beaconridge Dr
- 0 Brooklawn Dr Unit 98139376
- 15915 Dante Dr
- 6206 Briar Seasons Dr
- 15503 Winter Briar Dr
- 6210 Briar Seasons Dr
- 15507 Winter Briar Dr
- 6214 Briar Seasons Dr
- 15511 Winter Briar Dr
- 15514 Winter Briar Dr
- 6218 Briar Seasons Dr
- 15515 Winter Briar Dr
- 15518 Winter Briar Dr
- 15511 Fall Briar Dr
- 15706 Corsair Rd
- 15702 Corsair Rd
- 6222 Briar Seasons Dr
- 15519 Winter Briar Dr
- 15710 Corsair Rd
- 6130 Irish Hill Dr
- 15714 Corsair Rd
- 15523 Winter Briar Dr
- 15502 Fall Briar Dr