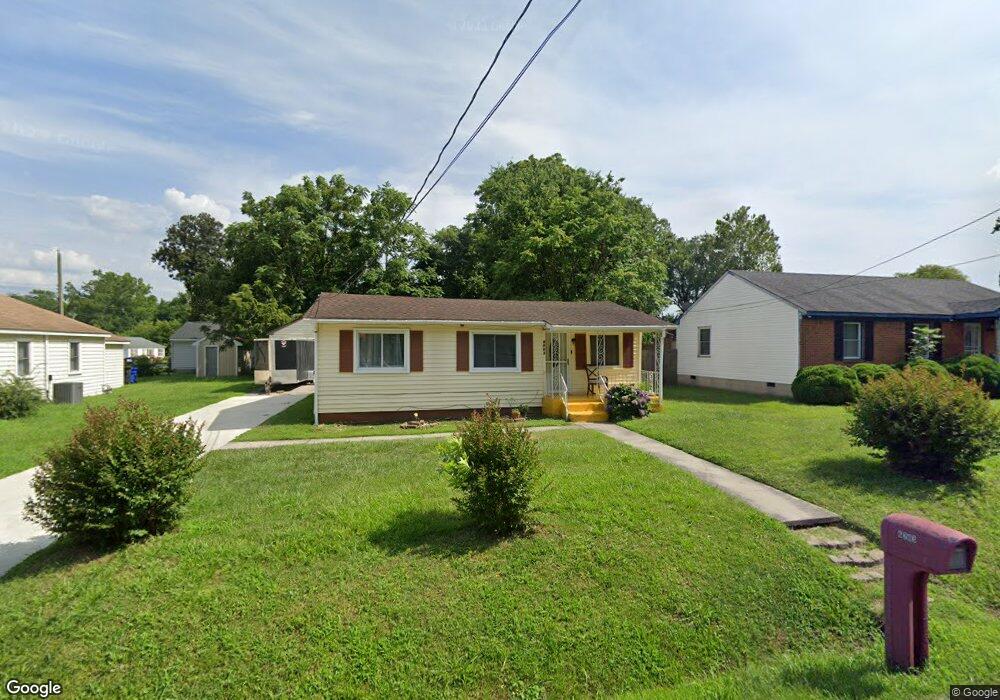
6203 Arthur Ave Portsmouth, VA 23703
Churchland NeighborhoodEstimated Value: $172,000 - $213,000
3
Beds
2
Baths
936
Sq Ft
$213/Sq Ft
Est. Value
About This Home
This home is located at 6203 Arthur Ave, Portsmouth, VA 23703 and is currently estimated at $199,734, approximately $213 per square foot. 6203 Arthur Ave is a home located in Portsmouth City with nearby schools including Churchland Elementary School, Churchland Academy Elementary School, and Churchland Middle School.
Ownership History
Date
Name
Owned For
Owner Type
Purchase Details
Closed on
Jul 31, 2017
Sold by
Bethea Sonia
Bought by
Bethea Lermon and Bethea Sonia
Current Estimated Value
Home Financials for this Owner
Home Financials are based on the most recent Mortgage that was taken out on this home.
Original Mortgage
$96,750
Outstanding Balance
$80,427
Interest Rate
3.91%
Mortgage Type
New Conventional
Estimated Equity
$119,307
Purchase Details
Closed on
Feb 10, 2016
Sold by
Wilmington Trust Na
Bought by
Bethea Sonia
Purchase Details
Closed on
Dec 14, 2015
Sold by
Professional Foreclosure Corp Of Virgini and Adams Mary
Bought by
Wilmington Trust Na Successor Trustee and Citibank Na As Trustee Fbo Holders Of St
Purchase Details
Closed on
Jun 30, 2006
Sold by
Moore Annette M
Bought by
Adams Mary
Home Financials for this Owner
Home Financials are based on the most recent Mortgage that was taken out on this home.
Original Mortgage
$15,600
Interest Rate
6.71%
Mortgage Type
Stand Alone Second
Create a Home Valuation Report for This Property
The Home Valuation Report is an in-depth analysis detailing your home's value as well as a comparison with similar homes in the area
Home Values in the Area
Average Home Value in this Area
Purchase History
| Date | Buyer | Sale Price | Title Company |
|---|---|---|---|
| Bethea Lermon | -- | None Available | |
| Bethea Sonia | $85,000 | Attorney | |
| Wilmington Trust Na Successor Trustee | $67,200 | None Available | |
| Adams Mary | $104,000 | -- |
Source: Public Records
Mortgage History
| Date | Status | Borrower | Loan Amount |
|---|---|---|---|
| Open | Bethea Lermon | $96,750 | |
| Previous Owner | Adams Mary | $15,600 | |
| Previous Owner | Adams Mary | $83,200 |
Source: Public Records
Tax History Compared to Growth
Tax History
| Year | Tax Paid | Tax Assessment Tax Assessment Total Assessment is a certain percentage of the fair market value that is determined by local assessors to be the total taxable value of land and additions on the property. | Land | Improvement |
|---|---|---|---|---|
| 2025 | $2,188 | $165,260 | $63,000 | $102,260 |
| 2024 | $2,188 | $163,970 | $63,000 | $100,970 |
| 2023 | $1,888 | $151,070 | $63,000 | $88,070 |
| 2022 | $1,718 | $132,190 | $52,500 | $79,690 |
| 2021 | $1,493 | $114,810 | $37,060 | $77,750 |
| 2020 | $1,453 | $111,750 | $35,290 | $76,460 |
| 2019 | $1,394 | $107,240 | $35,290 | $71,950 |
| 2018 | $1,394 | $107,240 | $35,290 | $71,950 |
| 2017 | $1,394 | $107,240 | $35,290 | $71,950 |
| 2016 | $1,394 | $107,240 | $35,290 | $71,950 |
| 2015 | $1,394 | $107,240 | $35,290 | $71,950 |
| 2014 | $1,362 | $107,240 | $35,290 | $71,950 |
Source: Public Records
Map
Nearby Homes
- 3604 Pierce St
- 6205 Dunkirk St
- 6015 Arthur Ave
- 6002 Campbell St
- 5911 Dunkirk St
- 3616 Bowden St
- 5806 Fawkes St
- 3660B Towne Point Rd Unit A
- 3791 Towne Point Rd
- 3836 Old Farm Rd
- 3860 Sugar Creek Cir
- 3604 Lilac Dr
- 3408 Kenley Ct
- 3817 Harvest Ct
- 3433 Willow Breeze Dr
- 3866 Augustine Cir
- 3715 Magnolia Dr
- 5516 Bingham Dr
- 3818 Peach Orchard Cir
- 3877 Peachtree Ln W
- 6205 Arthur Ave
- 3606 Blaine St
- 6207 Arthur Ave
- 6204 Arthur Ave
- 6206 Arthur Ave
- 6202 Arthur Ave
- 3604 Blaine St
- 6200 Arthur Ave
- 3615 Blaine St
- 3606 Pierce St
- 3602 Blaine St
- 6209 Arthur Ave
- 3609 Blaine St
- 6208 Arthur Ave
- 6110 Arthur Ave
- 3600 Pierce St
- 6105 Arthur Ave
- 3605 Blaine St
- 6301 Arthur Ave
- 6108 Arthur Ave