6204 Cross Swamp Rd Patterson, GA 31557
Estimated payment $508/month
Highlights
- Horses Allowed On Property
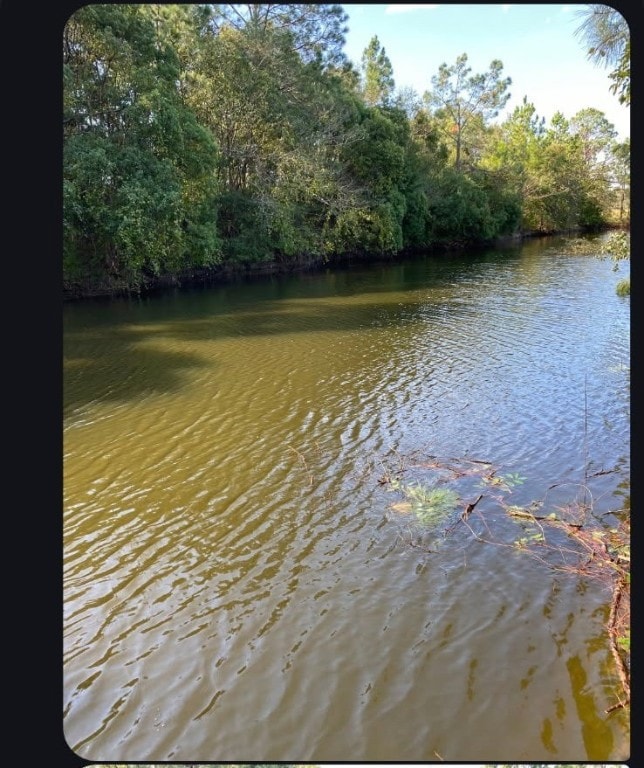
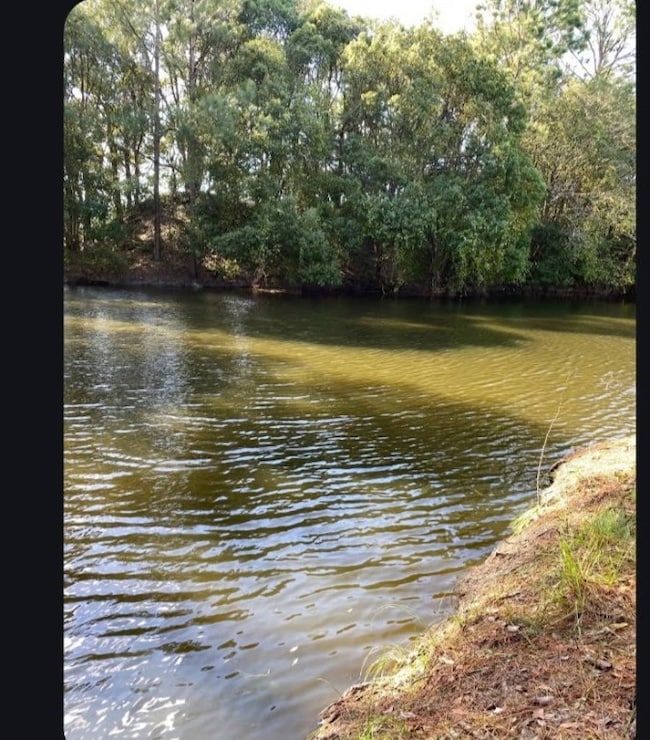
- Home fronts a pond
- No HOA
- Pierce County High School Rated A-
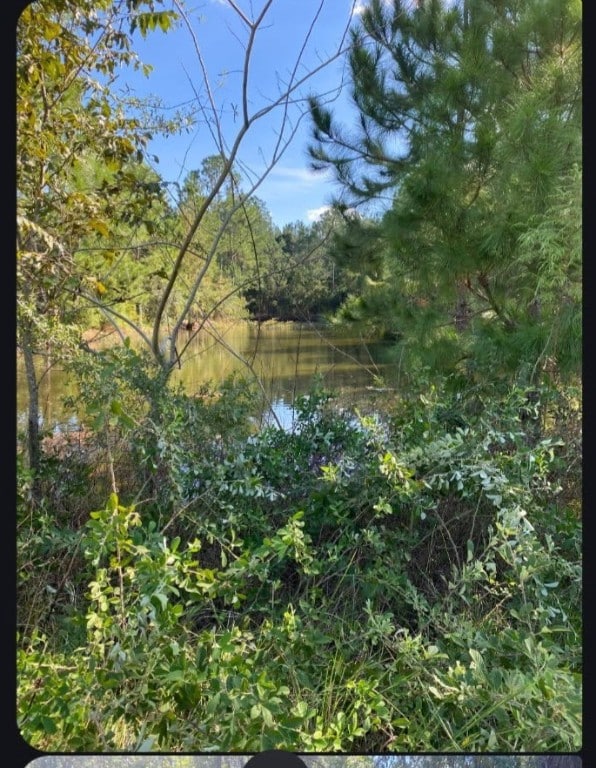
- Pond View
About This Lot
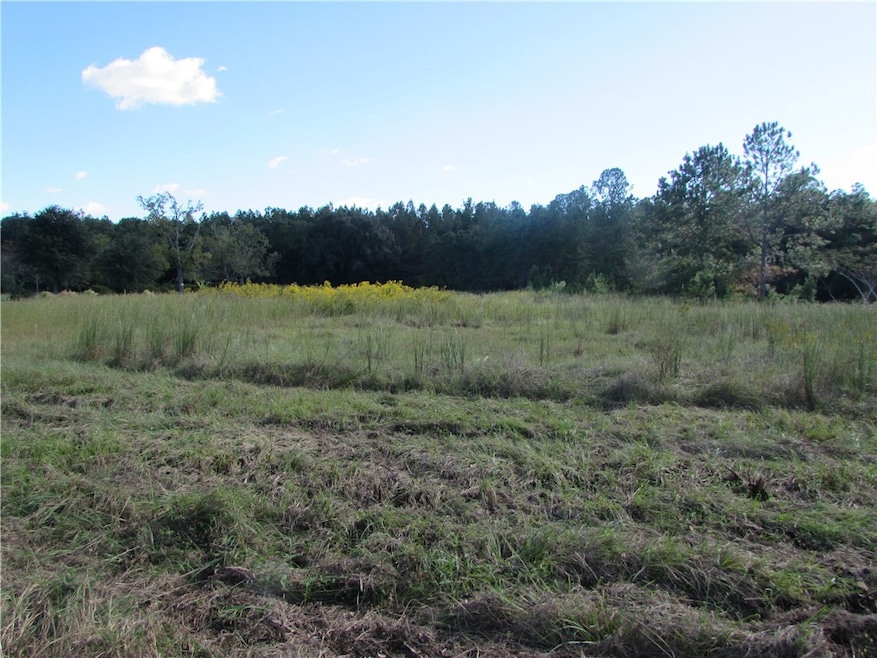
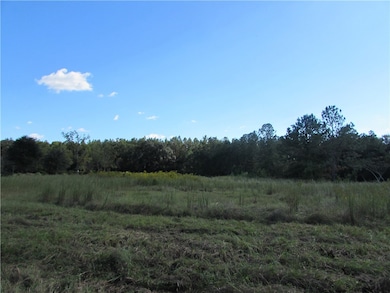
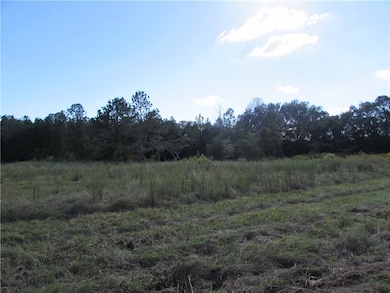
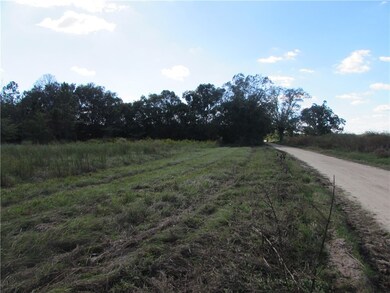
Here is the perfect place for your home in the country!! Drive through the countryside and just 1/2 mile off the paved road you will find this beautiful spot including a pond. Across the road you'll have a nice view of a big hay field. Very quiet and beautiful. This 4 acre parcel has been surveyed. It is level and not in a FEMA flood zone. The pond sits back on the property giving you plenty of room for building your home in a couple of different ways. This is not far from the Otter Creek area including the nice Otter Creek Restaurant. Town with grocery shopping is just a few miles away. The property is mostly cleared, but has some trees around the property line. A spot like this doesn't come along often. Don't miss it!
Property Details
Property Type
- Land
Lot Details
- 4 Acre Lot
- Home fronts a pond
- Zoning described as Agricultural,Mobile Home,Residential
Additional Features
- Pond Views
- Horses Allowed On Property
Community Details
- No Home Owners Association
Listing and Financial Details
- Assessor Parcel Number 068 026
Map
Home Values in the Area
Average Home Value in this Area
Tax History
| Year | Tax Paid | Tax Assessment Tax Assessment Total Assessment is a certain percentage of the fair market value that is determined by local assessors to be the total taxable value of land and additions on the property. | Land | Improvement |
|---|---|---|---|---|
| 2025 | $1,041 | $80,578 | $23,816 | $56,762 |
| 2024 | $1,041 | $78,896 | $23,816 | $55,080 |
| 2023 | $609 | $78,710 | $23,815 | $54,895 |
| 2022 | $718 | $47,351 | $14,780 | $32,571 |
| 2021 | $702 | $46,130 | $14,780 | $31,350 |
| 2020 | $710 | $44,910 | $14,780 | $30,130 |
| 2019 | $691 | $44,910 | $14,780 | $30,130 |
| 2018 | $649 | $41,363 | $14,076 | $27,287 |
| 2017 | $712 | $25,901 | $14,076 | $11,825 |
| 2016 | $248 | $25,901 | $14,076 | $11,825 |
| 2015 | $296 | $25,900 | $14,076 | $11,825 |
| 2014 | $296 | $25,901 | $14,076 | $11,825 |
| 2013 | $296 | $25,900 | $14,075 | $11,825 |
Property History
| Date | Event | Price | List to Sale | Price per Sq Ft |
|---|---|---|---|---|
| 10/15/2025 10/15/25 | For Sale | $80,000 | -- | -- |
Purchase History
| Date | Type | Sale Price | Title Company |
|---|---|---|---|
| Warranty Deed | -- | -- | |
| Warranty Deed | -- | -- | |
| Interfamily Deed Transfer | -- | -- | |
| Warranty Deed | -- | -- | |
| Deed | -- | -- | |
| Deed | -- | -- | |
| Deed | -- | -- | |
| Deed | -- | -- | |
| Deed | -- | -- | |
| Deed | -- | -- |
Source: Golden Isles Association of REALTORS®
MLS Number: 1657413
APN: 068-026
Disclaimer: Certain information contained herein is derived from information provided by parties other than Homes.com. All information provided is deemed reliable, but is not guaranteed to be accurate and should be independently verified.
![]() IDX information is provided exclusively for personal, non-commercial use, and may not be used for any purpose other than to identify prospective properties consumers may be interested in purchasing. Information is deemed reliable but not guaranteed.
IDX information is provided exclusively for personal, non-commercial use, and may not be used for any purpose other than to identify prospective properties consumers may be interested in purchasing. Information is deemed reliable but not guaranteed.
- 0 Otter Creek Rd Unit 23325273
- 5907 Owens Rd
- 4858 Stanfield Cir
- 4861 Stanfield Cir
- 6162 Griner Rd
- 5466 Robin Rd
- 3881 Cut Path Rd
- 5502 Howard Rd
- 4750 Otter Creek Cir
- 4725 Otter Creek Cir
- 4720 Otter Creek Cir
- 6034 E Main St
- 5947 Reese St
- 3548 Williams St
- 5525 E Railroad Ave
- 5518 W Railroad Ave
- 3532 Dallas St
- Tract 1 Unit Trudie Rd
- 2460 Thornton Rd
- 0 Roberson Rd
- 2404 Spurgeon St
- 2018 El Josa St
- 3625 Tanner Ln
- 808 Brunel St
- 2007 Creswell St
- 110 Villa Rd
- 775 Catherine St
- 989 Sunset Blvd
- 895 S 1st St
- 609 Clover St
- 712 S 6th St
- 397 S Palm St
- 277 Myrtle Ave
- 890 E Cherry (103) St Unit 103
- 890 E Cherry St Unit 102
- 284 E Pine St
- 650 Lanes Bridge Rd
- 34 Riverside Dr
- 60 Riverside Dr
- 267 Rodman Rd
