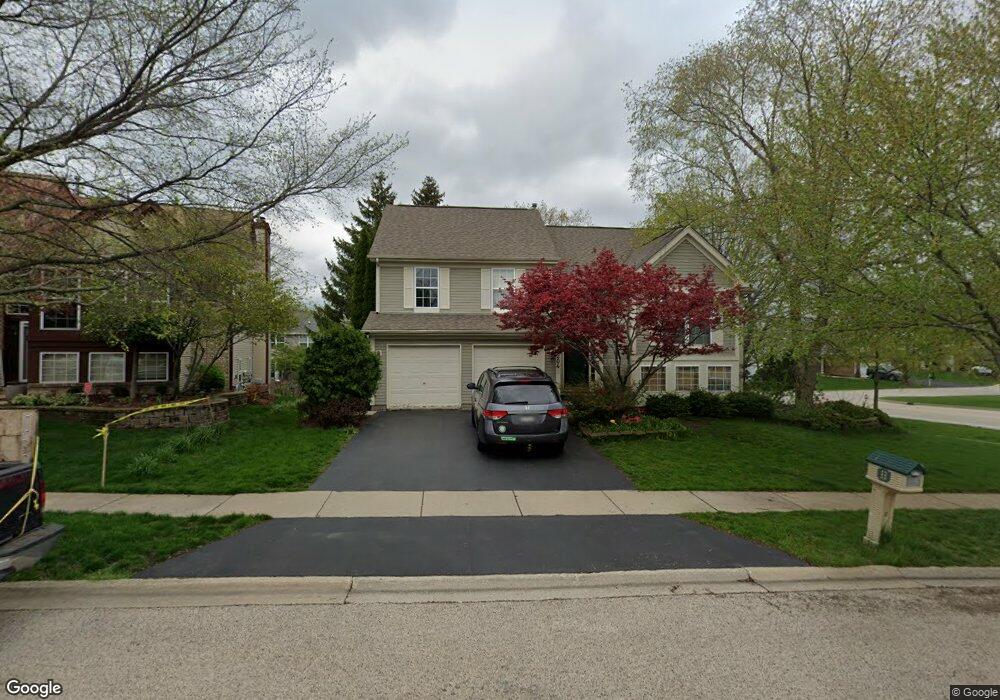
6204 Formoor Ln Unit 4 Gurnee, IL 60031
Estimated Value: $442,098 - $466,000
4
Beds
3
Baths
2,630
Sq Ft
$174/Sq Ft
Est. Value
About This Home
This home is located at 6204 Formoor Ln Unit 4, Gurnee, IL 60031 and is currently estimated at $456,775, approximately $173 per square foot. 6204 Formoor Ln Unit 4 is a home located in Lake County with nearby schools including Woodland Primary School, Woodland Elementary School, and Woodland Intermediate School.
Ownership History
Date
Name
Owned For
Owner Type
Purchase Details
Closed on
Aug 7, 2015
Sold by
Pineres Joy A and Dumke David A
Bought by
The David & Joy Dumke Living Trust
Current Estimated Value
Purchase Details
Closed on
Mar 31, 2003
Sold by
Montgomery Bruce and Montgomery Nadzija
Bought by
Pineres James M and Pineres Joy A
Home Financials for this Owner
Home Financials are based on the most recent Mortgage that was taken out on this home.
Original Mortgage
$272,550
Interest Rate
3.87%
Mortgage Type
Purchase Money Mortgage
Purchase Details
Closed on
Aug 4, 1995
Sold by
Northern Tr Bank Lake Forest Natl Assn
Bought by
Montgomery Bruce and Montgomery Nadzija
Home Financials for this Owner
Home Financials are based on the most recent Mortgage that was taken out on this home.
Original Mortgage
$190,400
Interest Rate
7.25%
Create a Home Valuation Report for This Property
The Home Valuation Report is an in-depth analysis detailing your home's value as well as a comparison with similar homes in the area
Home Values in the Area
Average Home Value in this Area
Purchase History
| Date | Buyer | Sale Price | Title Company |
|---|---|---|---|
| The David & Joy Dumke Living Trust | -- | Attorney | |
| Pineres James M | $341,000 | Chicago Title Insurance Comp | |
| Montgomery Bruce | $201,000 | Chicago Title Insurance Co |
Source: Public Records
Mortgage History
| Date | Status | Borrower | Loan Amount |
|---|---|---|---|
| Previous Owner | Pineres James M | $272,550 | |
| Previous Owner | Montgomery Bruce | $190,400 | |
| Closed | Pineres James M | $51,100 |
Source: Public Records
Tax History Compared to Growth
Tax History
| Year | Tax Paid | Tax Assessment Tax Assessment Total Assessment is a certain percentage of the fair market value that is determined by local assessors to be the total taxable value of land and additions on the property. | Land | Improvement |
|---|---|---|---|---|
| 2024 | $9,760 | $123,801 | $17,002 | $106,799 |
| 2023 | $9,893 | $107,320 | $14,739 | $92,581 |
| 2022 | $9,893 | $101,493 | $14,744 | $86,749 |
| 2021 | $8,410 | $97,420 | $14,152 | $83,268 |
| 2020 | $8,685 | $95,025 | $13,804 | $81,221 |
| 2019 | $7,904 | $92,266 | $13,403 | $78,863 |
| 2018 | $7,296 | $89,721 | $16,519 | $73,202 |
| 2017 | $8,045 | $87,150 | $16,046 | $71,104 |
| 2016 | $7,427 | $83,270 | $15,332 | $67,938 |
| 2015 | $7,823 | $78,974 | $14,541 | $64,433 |
| 2014 | $7,825 | $79,597 | $14,361 | $65,236 |
| 2012 | $7,037 | $80,207 | $14,471 | $65,736 |
Source: Public Records
Map
Nearby Homes
- 6141 Crossland Blvd
- 920 Vose Dr Unit 304
- 920 Vose Dr Unit 106
- 920 Vose Dr Unit 105
- 917 Vose Dr Unit 304
- 914 Vose Dr
- 6121 Brookstone Place
- 776 Chandler Rd
- 741 Colby Ct Unit U42
- 690 Chandler Rd Unit 102
- 690 Chandler Rd Unit 207
- 690 Chandler Rd Unit 305
- 650 Whitney Ct Unit 108
- 650 Whitney Ct Unit 203
- 6296 Doral Dr
- 6359 Doral Dr
- 651 White Ct
- 32956 N Ashley Dr
- 6161 Oakmont Ln
- 6191 Oakmont Ln
- 6208 Formoor Ln Unit 4
- 6237 Crossland Blvd Unit 2
- 6212 Formoor Ln
- 6203 Formoor Ln
- 825 Dunhill Ct
- 6245 Crossland Blvd Unit 2
- 6215 Formoor Ln
- 6216 Formoor Ln
- 6253 Crossland Blvd
- 829 Compton Ct
- 801 Dunhill Ct
- 821 Dunhill Ct
- 6261 Crossland Blvd
- 6220 Formoor Ln
- 6237 Formoor Ln
- 6233 Formoor Ln
- 6197 Crossland Blvd
- 6269 Crossland Blvd
- 833 Compton Ct
- 6224 Formoor Ln