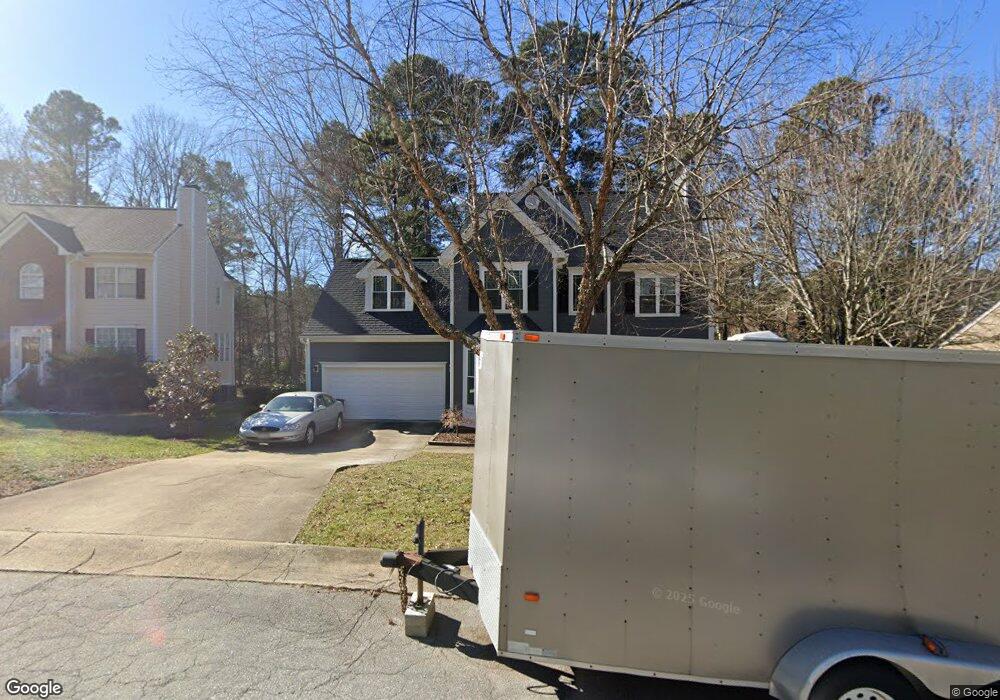
6205 Chesden Dr Durham, NC 27713
Woodcroft NeighborhoodEstimated Value: $503,000 - $557,000
4
Beds
3
Baths
2,100
Sq Ft
$254/Sq Ft
Est. Value
About This Home
This home is located at 6205 Chesden Dr, Durham, NC 27713 and is currently estimated at $533,241, approximately $253 per square foot. 6205 Chesden Dr is a home located in Durham County with nearby schools including Pearsontown Elementary School, Lowe's Grove Middle, and Hillside High School.
Ownership History
Date
Name
Owned For
Owner Type
Purchase Details
Closed on
Sep 23, 2017
Sold by
Harden Jacqueline M and Jacobs Gregory A
Bought by
Jacobs Jacqueline M
Current Estimated Value
Home Financials for this Owner
Home Financials are based on the most recent Mortgage that was taken out on this home.
Original Mortgage
$218,000
Outstanding Balance
$117,569
Interest Rate
3.9%
Mortgage Type
New Conventional
Estimated Equity
$415,672
Purchase Details
Closed on
Feb 10, 2005
Sold by
Cendant Mobility Financial Corp
Bought by
Harden Jacqueline M
Home Financials for this Owner
Home Financials are based on the most recent Mortgage that was taken out on this home.
Original Mortgage
$180,000
Interest Rate
4.5%
Mortgage Type
Purchase Money Mortgage
Purchase Details
Closed on
Nov 23, 2004
Sold by
Stancato Rebecca C and Stancato Louis F
Bought by
Cendant Mobility Financial Corp
Create a Home Valuation Report for This Property
The Home Valuation Report is an in-depth analysis detailing your home's value as well as a comparison with similar homes in the area
Home Values in the Area
Average Home Value in this Area
Purchase History
| Date | Buyer | Sale Price | Title Company |
|---|---|---|---|
| Jacobs Jacqueline M | -- | Servicelink | |
| Harden Jacqueline M | $225,000 | Bb&T | |
| Cendant Mobility Financial Corp | $229,000 | -- |
Source: Public Records
Mortgage History
| Date | Status | Borrower | Loan Amount |
|---|---|---|---|
| Open | Jacobs Jacqueline M | $218,000 | |
| Closed | Harden Jacqueline M | $180,000 | |
| Closed | Harden Jacqueline M | $45,000 |
Source: Public Records
Tax History
| Year | Tax Paid | Tax Assessment Tax Assessment Total Assessment is a certain percentage of the fair market value that is determined by local assessors to be the total taxable value of land and additions on the property. | Land | Improvement |
|---|---|---|---|---|
| 2025 | $5,407 | $545,417 | $162,500 | $382,917 |
| 2024 | $4,187 | $300,143 | $46,837 | $253,306 |
| 2023 | $3,932 | $300,143 | $46,837 | $253,306 |
| 2022 | $3,842 | $300,143 | $46,837 | $253,306 |
| 2021 | $3,824 | $300,143 | $46,837 | $253,306 |
| 2020 | $3,733 | $300,143 | $46,837 | $253,306 |
| 2019 | $3,733 | $300,143 | $46,837 | $253,306 |
| 2018 | $2,915 | $214,900 | $46,837 | $168,063 |
| 2017 | $2,894 | $214,900 | $46,837 | $168,063 |
| 2016 | $2,796 | $214,900 | $46,837 | $168,063 |
| 2015 | $3,365 | $243,055 | $48,220 | $194,835 |
| 2014 | $3,365 | $243,055 | $48,220 | $194,835 |
Source: Public Records
Map
Nearby Homes
- 8 Drummond Ct
- 63 Lake Village Dr
- 6004 Tahoe Dr
- 6502 Barbee Rd
- 5624 Barbee Rd
- 1001 Pebble Creek Crossing Unit 11
- 32 Brafferton Ct
- 1058 Flagler St
- 12 Byerly Ct
- 1062 Flagler St
- 11 Bridgeport Dr
- 10 Bridgeport Dr
- 1 Chownings St
- 5511 Tahoe Dr
- 1129 Pebble Creek Crossing
- 6500 Amber Springs Dr
- 6519 Amber Springs Dr
- 3105 Dunnock Dr
- 5708 Catskill Ct
- 1101 Canary Pepper Dr
Your Personal Tour Guide
Ask me questions while you tour the home.