6205 Coles Rd Langley, WA 98260
Estimated Value: $890,000 - $1,309,000
4
Beds
3
Baths
2,663
Sq Ft
$383/Sq Ft
Est. Value
About This Home
This home is located at 6205 Coles Rd, Langley, WA 98260 and is currently estimated at $1,019,455, approximately $382 per square foot. 6205 Coles Rd is a home located in Island County with nearby schools including South Whidbey Elementary School, South Whidbey Middle School, and South Whidbey High School.
Ownership History
Date
Name
Owned For
Owner Type
Purchase Details
Closed on
Jan 20, 2021
Sold by
Cox Steven Michael and Cox Jennfier Ann
Bought by
Cox Steven M and Cox Jennfier Ann
Current Estimated Value
Home Financials for this Owner
Home Financials are based on the most recent Mortgage that was taken out on this home.
Original Mortgage
$281,922
Outstanding Balance
$251,040
Interest Rate
2.71%
Mortgage Type
VA
Estimated Equity
$768,415
Purchase Details
Closed on
May 18, 2010
Sold by
Wilson Todd and Wilson Lana
Bought by
Cox Steven Michael and Cox Jennifer Ann
Home Financials for this Owner
Home Financials are based on the most recent Mortgage that was taken out on this home.
Original Mortgage
$325,000
Interest Rate
5.21%
Mortgage Type
VA
Create a Home Valuation Report for This Property
The Home Valuation Report is an in-depth analysis detailing your home's value as well as a comparison with similar homes in the area
Home Values in the Area
Average Home Value in this Area
Purchase History
| Date | Buyer | Sale Price | Title Company |
|---|---|---|---|
| Cox Steven M | -- | Chicago Title Co Of Wa | |
| Cox Steven Michael | $415,000 | Stg |
Source: Public Records
Mortgage History
| Date | Status | Borrower | Loan Amount |
|---|---|---|---|
| Open | Cox Steven M | $281,922 | |
| Closed | Cox Steven Michael | $325,000 |
Source: Public Records
Tax History Compared to Growth
Tax History
| Year | Tax Paid | Tax Assessment Tax Assessment Total Assessment is a certain percentage of the fair market value that is determined by local assessors to be the total taxable value of land and additions on the property. | Land | Improvement |
|---|---|---|---|---|
| 2025 | $5,274 | $737,124 | $310,000 | $427,124 |
| 2024 | $4,774 | $732,257 | $300,000 | $432,257 |
| 2023 | $4,774 | $727,386 | $290,000 | $437,386 |
| 2022 | $4,210 | $670,714 | $270,000 | $400,714 |
| 2021 | $3,886 | $527,480 | $175,000 | $352,480 |
| 2020 | $3,552 | $496,144 | $165,000 | $331,144 |
| 2019 | $3,350 | $465,151 | $200,000 | $265,151 |
| 2018 | $3,415 | $435,920 | $170,000 | $265,920 |
| 2017 | $2,953 | $411,728 | $150,000 | $261,728 |
| 2016 | $2,878 | $389,737 | $125,000 | $264,737 |
| 2015 | $2,621 | $367,745 | $100,000 | $267,745 |
| 2013 | -- | $326,811 | $95,000 | $231,811 |
Source: Public Records
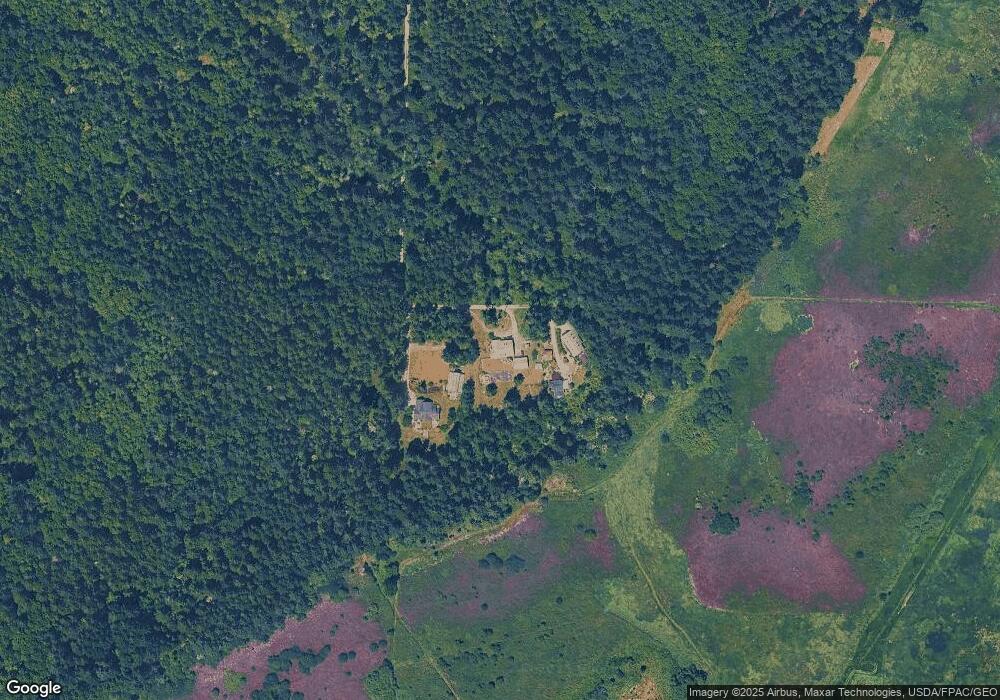
Map
Nearby Homes
- 5970 Maxwelton Rd
- 11652 State Route 525
- 0 XXX Sills Rd
- 6301 Sahalee Ct
- 6329 Sahalee Ct
- 6292 Sahalee Ct
- 5777 Kramer Rd
- 4105 Tartan Way
- 0 Sahalee Ct
- 2903 Grimm Rd
- 4324 Shadowood Dr
- 4369 Shadowood Dr
- 6255 Turkey Hill Rd
- 2872 Hi Crest Rd
- 5392 April Dr
- 2923 Lakeview Way
- 0 April Dr
- 2568 Myra Place
- 2575 Hillis Dr
- 2465 Discovery Place
- 6209 Coles Rd
- 6201 Coles Rd
- 6111 Coles Rd
- 6310 Maxwelton Rd
- 6051 Coles Rd
- 0 Kirkhill Rd Unit 1539022
- 6075 Coles Rd
- 6256 Kirkhill Rd
- 6285 Kirkhill Rd
- 0 XXXX Kirkhill Rd
- 0 xxx Kirkhill Rd
- 6045 Coles Rd
- 6371 Kirkhill Rd
- 6367 Kirkhill Rd
- 6332 Kirkhill Rd
- 6264 Maxwelton Rd
- 6007 Coles Rd
- 6312 Maxwelton Rd
- 6389 Kirkhill Rd
- 6303 Kirkhill Rd