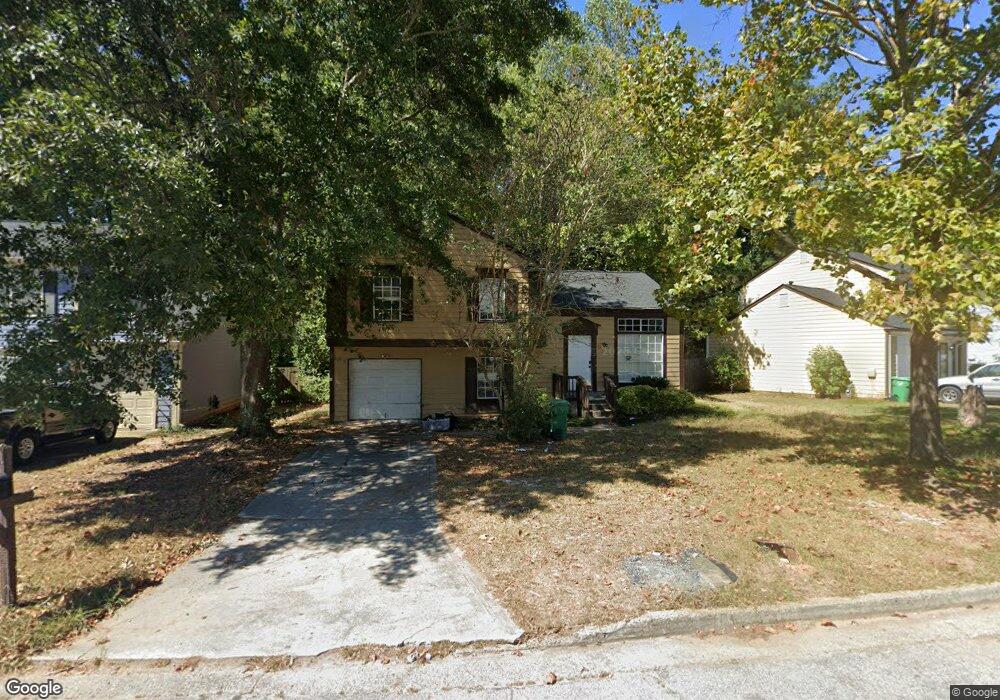
6205 Marbut Farms Chase Lithonia, GA 30058
Estimated Value: $199,000 - $226,000
3
Beds
3
Baths
1,783
Sq Ft
$120/Sq Ft
Est. Value
About This Home
This home is located at 6205 Marbut Farms Chase, Lithonia, GA 30058 and is currently estimated at $213,680, approximately $119 per square foot. 6205 Marbut Farms Chase is a home located in DeKalb County with nearby schools including Panola Way Elementary School, Lithonia Middle School, and Lithonia High School.
Ownership History
Date
Name
Owned For
Owner Type
Purchase Details
Closed on
Nov 29, 2023
Sold by
Impact Marketing Solutions Llc
Bought by
6205 Marbut Trust and Jones Jacobi
Current Estimated Value
Purchase Details
Closed on
Mar 9, 2010
Sold by
Bank Of Ny Mellon 2002-Bc7
Bought by
Impact Marketing Solutions Llc
Purchase Details
Closed on
Nov 3, 2009
Sold by
Mack Alfred B
Bought by
Structured Asset Secs 2002-Bc7
Purchase Details
Closed on
May 31, 2001
Sold by
Hud
Bought by
Mack Alfred B
Home Financials for this Owner
Home Financials are based on the most recent Mortgage that was taken out on this home.
Original Mortgage
$64,600
Interest Rate
7.05%
Mortgage Type
New Conventional
Purchase Details
Closed on
Dec 7, 1999
Sold by
Norwest Mtg Inc
Bought by
Secretary and Hud
Purchase Details
Closed on
Mar 14, 1996
Sold by
Hud
Bought by
Davis Brian C
Purchase Details
Closed on
Sep 5, 1995
Sold by
Bancplus Mtg Corp
Bought by
Secretary Of Hud
Create a Home Valuation Report for This Property
The Home Valuation Report is an in-depth analysis detailing your home's value as well as a comparison with similar homes in the area
Home Values in the Area
Average Home Value in this Area
Purchase History
| Date | Buyer | Sale Price | Title Company |
|---|---|---|---|
| 6205 Marbut Trust | -- | -- | |
| Impact Marketing Solutions Llc | $28,900 | -- | |
| Structured Asset Secs 2002-Bc7 | $25,575 | -- | |
| Mack Alfred B | -- | -- | |
| Secretary | -- | -- | |
| Norwest Mtg Inc | $87,391 | -- | |
| Davis Brian C | -- | -- | |
| Secretary Of Hud | -- | -- | |
| Bancplus Mtg Corp | $81,300 | -- |
Source: Public Records
Mortgage History
| Date | Status | Borrower | Loan Amount |
|---|---|---|---|
| Previous Owner | Mack Alfred B | $64,600 | |
| Closed | Davis Brian C | $0 |
Source: Public Records
Tax History Compared to Growth
Tax History
| Year | Tax Paid | Tax Assessment Tax Assessment Total Assessment is a certain percentage of the fair market value that is determined by local assessors to be the total taxable value of land and additions on the property. | Land | Improvement |
|---|---|---|---|---|
| 2025 | $3,964 | $80,960 | $15,000 | $65,960 |
| 2024 | $4,075 | $83,600 | $15,000 | $68,600 |
| 2023 | $4,075 | $75,440 | $15,000 | $60,440 |
| 2022 | $3,087 | $63,200 | $15,000 | $48,200 |
| 2021 | $2,235 | $43,800 | $7,200 | $36,600 |
| 2020 | $2,007 | $38,600 | $7,200 | $31,400 |
| 2019 | $1,746 | $32,640 | $7,200 | $25,440 |
| 2018 | $1,603 | $32,840 | $7,200 | $25,640 |
| 2017 | $1,530 | $27,600 | $3,280 | $24,320 |
| 2016 | $1,374 | $24,000 | $3,280 | $20,720 |
| 2014 | $1,405 | $24,120 | $3,280 | $20,840 |
Source: Public Records
Map
Nearby Homes
- 6248 Marbut Farms Ln
- 6185 Marbut Farms Chase
- 6202 Saint Christophers Ct
- 2216 Marbut Farms Trace
- 2360 Anne's Lake Cir
- 6260 Marbut Farms Terrace
- 6182 Saint Charles Ct
- 2293 Cherokee Valley Dr Unit 3
- 2211 Jonathan Ave
- 2191 Phillips Rd
- 6315 Noreen Way
- 1882 Corners Cir
- 6248 Creekford Ln
- 6268 Creekford Ln
- 2338 Rambling Way
- 2247 Cherokee Valley Dr
- 2285 Cherokee Valley Cir Unit III
- 6300 Creekford Ln
- 6255 Creekford Ln Unit 4
- 2281 Rambling Way
- 6199 Marbut Farms Chase
- 6209 Marbut Farms Chase
- 6193 Marbut Farms Chase
- 6198 Hyde Park Ln
- 6214 Marbut Farms Chase
- 6185 Marbut Farms Trail
- 6199 Hyde Park Ln
- 6189 Marbut Farms Chase
- 6238 Marbut Farms Trail
- 6219 Marbut Farms Chase
- 6239 Marbut Farms Trail
- 6193 Hyde Park Ln
- 6194 Marbut Farms Chase
- 6198 Charring Cross Ct
- 6222 Marbut Farms Chase
- 6194 Hyde Park Ln
- 6238 Marbut Farms Ln
- 6188 Marbut Farms Chase
- 6194 Charring Cross Ct
- 6243 Marbut Farms Trail