Estimated Value: $425,952 - $451,000
3
Beds
2
Baths
1,904
Sq Ft
$231/Sq Ft
Est. Value
About This Home
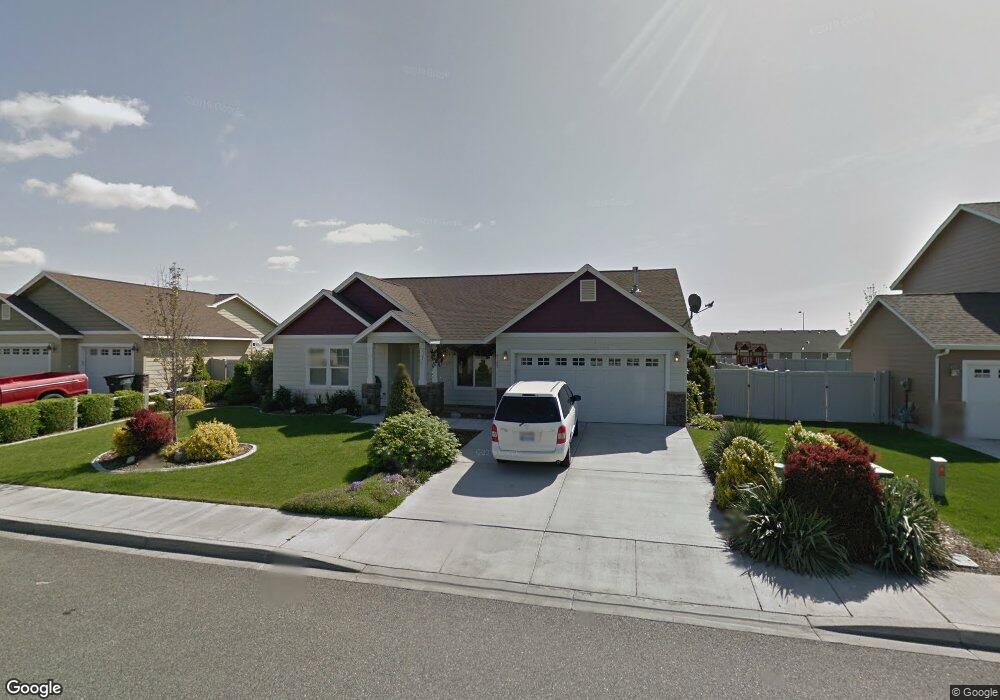
This home is located at 6207 Chehalis Ln, Pasco, WA 99301 and is currently estimated at $439,488, approximately $230 per square foot. 6207 Chehalis Ln is a home located in Franklin County with nearby schools including Maya Angelou Elementary School, McLoughlin Middle School, and Chiawana High School.
Ownership History
Date
Name
Owned For
Owner Type
Purchase Details
Closed on
Aug 30, 2016
Sold by
Reed Kathleen T
Bought by
Reed Fred G
Current Estimated Value
Home Financials for this Owner
Home Financials are based on the most recent Mortgage that was taken out on this home.
Original Mortgage
$174,000
Outstanding Balance
$138,985
Interest Rate
3.43%
Mortgage Type
New Conventional
Estimated Equity
$300,503
Purchase Details
Closed on
Aug 26, 2005
Sold by
Reed Shareen
Bought by
Reed Fred G
Home Financials for this Owner
Home Financials are based on the most recent Mortgage that was taken out on this home.
Original Mortgage
$172,294
Interest Rate
5.64%
Mortgage Type
FHA
Purchase Details
Closed on
Apr 25, 2005
Sold by
Gallup Christi
Bought by
Reed Fred G
Home Financials for this Owner
Home Financials are based on the most recent Mortgage that was taken out on this home.
Original Mortgage
$172,197
Interest Rate
5.84%
Mortgage Type
FHA
Create a Home Valuation Report for This Property
The Home Valuation Report is an in-depth analysis detailing your home's value as well as a comparison with similar homes in the area
Home Values in the Area
Average Home Value in this Area
Purchase History
| Date | Buyer | Sale Price | Title Company |
|---|---|---|---|
| Reed Fred G | -- | Frontier Title & Escrow | |
| Reed Fred G | -- | Cascade Title | |
| Reed Fred G | $174,900 | Chicago Title |
Source: Public Records
Mortgage History
| Date | Status | Borrower | Loan Amount |
|---|---|---|---|
| Open | Reed Fred G | $174,000 | |
| Closed | Reed Fred G | $172,294 | |
| Closed | Reed Fred G | $172,197 |
Source: Public Records
Tax History
| Year | Tax Paid | Tax Assessment Tax Assessment Total Assessment is a certain percentage of the fair market value that is determined by local assessors to be the total taxable value of land and additions on the property. | Land | Improvement |
|---|---|---|---|---|
| 2025 | $1,976 | $470,100 | $132,500 | $337,600 |
| 2023 | $3,702 | $470,100 | $132,500 | $337,600 |
| 2022 | $2,975 | $333,700 | $90,200 | $243,500 |
| 2021 | $2,945 | $293,000 | $66,600 | $226,400 |
| 2019 | $2,355 | $231,900 | $54,100 | $177,800 |
| 2018 | $2,693 | $216,400 | $45,100 | $171,300 |
| 2017 | $2,585 | $208,400 | $30,900 | $177,500 |
| 2015 | $2,567 | $195,000 | $30,000 | $165,000 |
| 2013 | -- | $195,000 | $30,000 | $165,000 |
Source: Public Records
Map
Nearby Homes
- 8217 Silver Mound Dr
- 8215 Ashen Dr
- 8408 Studebaker Dr
- 7823 Rush Creek Dr
- 8709 Silver Mound Dr
- 8717 Silver Mound Dr
- 8802 Silver Mound Dr
- 8203 Whidbey Dr
- 8718 Dusty Maiden Dr
- 6619 Road 68
- 8813 Dusty Maiden Dr
- 8713 Dusty Maiden Dr
- 8717 Dusty Maiden Dr
- 8705 Dusty Maiden Dr
- 6102 Westmoreland Ln
- 8415 Lancaster Dr
- 8412 Lancaster Dr
- 6102 Road 90
- 6014 Cotswold Ln
- 6313 Balmoral Ct
- 6211 Chehalis Ln
- 6203 Chehalis Ln
- 6208 Salmon Dr
- 6212 Salmon Dr
- 6215 Chehalis Ln
- 6115 Chehalis Ln
- 6204 Salmon Dr
- 6208 Chehalis Ln
- 6204 Chehalis Ln
- 6212 Chehalis Ln
- 6114 Salmon Dr
- 6219 Chehalis Ln
- 8011 Skagit Dr
- 6111 Chehalis Ln Unit Perfectly Designed 2
- 6111 Chehalis Ln Unit Stunning & Immaculan
- 6111 Chehalis Ln
- 6116 Chehalis Ln
- 6216 Chehalis Ln
- 6112 Chehalis Ln
- 6205 Salmon Dr
Your Personal Tour Guide
Ask me questions while you tour the home.