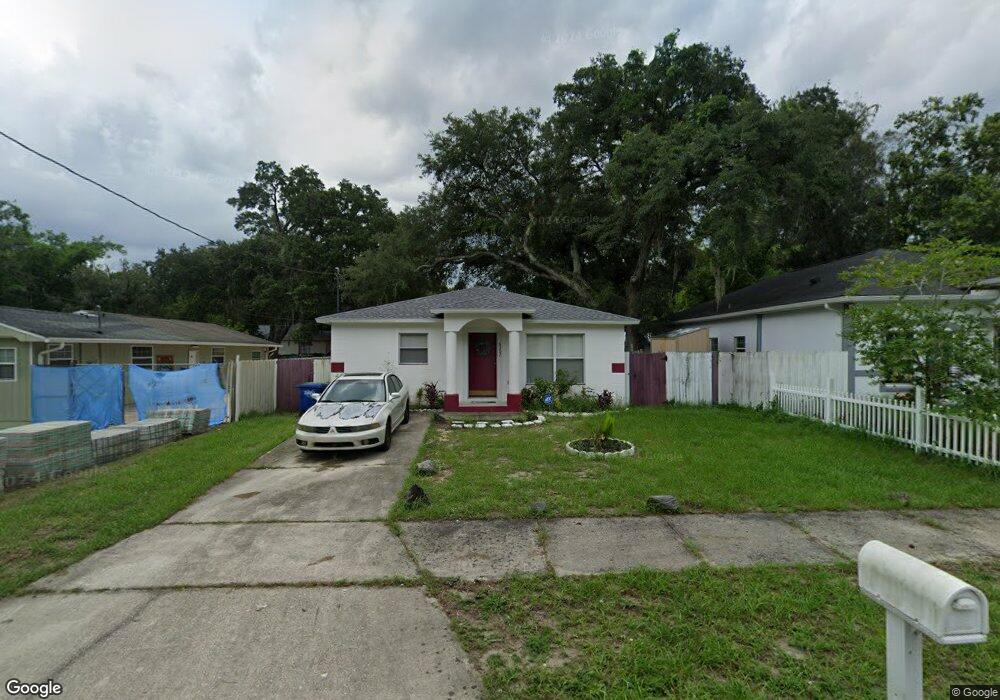
6207 N 38th St Tampa, FL 33610
Seminole Heights NeighborhoodEstimated Value: $213,000 - $288,000
3
Beds
2
Baths
1,200
Sq Ft
$213/Sq Ft
Est. Value
About This Home
This home is located at 6207 N 38th St, Tampa, FL 33610 and is currently estimated at $255,341, approximately $212 per square foot. 6207 N 38th St is a home located in Hillsborough County with nearby schools including Sheehy Elementary School, Sligh Middle School, and King High School.
Ownership History
Date
Name
Owned For
Owner Type
Purchase Details
Closed on
Oct 5, 2006
Sold by
Brown Randolph E
Bought by
Gilbert Bernadette L
Current Estimated Value
Home Financials for this Owner
Home Financials are based on the most recent Mortgage that was taken out on this home.
Original Mortgage
$122,400
Outstanding Balance
$73,039
Interest Rate
6.46%
Mortgage Type
Unknown
Estimated Equity
$182,303
Purchase Details
Closed on
Mar 17, 2006
Sold by
Matthews Dorian L
Bought by
Brown Randolph E
Purchase Details
Closed on
Oct 24, 2003
Sold by
New Millenial Lc
Bought by
Matthews Dorian
Home Financials for this Owner
Home Financials are based on the most recent Mortgage that was taken out on this home.
Original Mortgage
$90,755
Interest Rate
6.03%
Mortgage Type
Unknown
Purchase Details
Closed on
May 15, 2003
Sold by
Young Willis
Bought by
New Millennial Lc
Purchase Details
Closed on
Jul 17, 1997
Sold by
Horne Ronald H and Horne C
Bought by
Young Willis
Create a Home Valuation Report for This Property
The Home Valuation Report is an in-depth analysis detailing your home's value as well as a comparison with similar homes in the area
Home Values in the Area
Average Home Value in this Area
Purchase History
| Date | Buyer | Sale Price | Title Company |
|---|---|---|---|
| Gilbert Bernadette L | $144,900 | Peer Title Inc | |
| Brown Randolph E | $87,200 | None Available | |
| Matthews Dorian | $92,200 | Fuentes & Kreischer Title Co | |
| New Millennial Lc | $8,500 | Fuentes & Kreischer Title Co | |
| Young Willis | $3,000 | -- |
Source: Public Records
Mortgage History
| Date | Status | Borrower | Loan Amount |
|---|---|---|---|
| Open | Gilbert Bernadette L | $122,400 | |
| Previous Owner | Matthews Dorian | $90,755 |
Source: Public Records
Tax History Compared to Growth
Tax History
| Year | Tax Paid | Tax Assessment Tax Assessment Total Assessment is a certain percentage of the fair market value that is determined by local assessors to be the total taxable value of land and additions on the property. | Land | Improvement |
|---|---|---|---|---|
| 2024 | $501 | $45,812 | -- | -- |
| 2023 | $479 | $44,478 | $0 | $0 |
| 2022 | $456 | $43,183 | $0 | $0 |
| 2021 | $438 | $41,925 | $0 | $0 |
| 2020 | $425 | $41,346 | $0 | $0 |
| 2019 | $402 | $40,416 | $0 | $0 |
| 2018 | $385 | $39,662 | $0 | $0 |
| 2017 | $367 | $67,907 | $0 | $0 |
| 2016 | $344 | $38,047 | $0 | $0 |
| 2015 | $316 | $37,783 | $0 | $0 |
| 2014 | $283 | $37,483 | $0 | $0 |
| 2013 | -- | $36,929 | $0 | $0 |
Source: Public Records
Map
Nearby Homes
- 3720 E Idlewild Ave
- 3722 E Idlewild Ave
- 3717 E Clifton St
- 3713 E Clifton St
- 6443 N 40th St
- 6415 N 40th St
- 4015 E Idlewild Ave
- 4102 E Hanna Ave
- 3410 Grove Street Cir
- 5901 N 34th St
- 3608 E Powhatan Ave
- 4207 E Paris St
- 3410 E Henry Ave
- 6411 N 34th St
- 3422 E Powhatan Ave
- 3425 E Powhatan Ave
- 3632 E Comanche Ave
- 5501 N 37th St
- 4207 E Henry Ave
- 3202 E Jean St
- 3804 E Hanna Ave
- 6205 N 38th St
- 3803 E Hanna Ave
- 3801 E Hanna Ave
- 3713 E Hanna Ave
- 6202 N 39th St
- 3807 E Hanna Ave
- 6202 N 38th St
- 3711 E Hanna Ave
- 6206 N 38th St
- 6209 N 38th St
- 6206 N 39th St
- 3709 E Hanna Ave
- 3811 E Hanna Ave
- 6208 N 38th St
- 3712 E Paris St
- 3720 E Paris St
- 6211 N 38th St
- 6210 N 38th St
- 3710 E Paris St