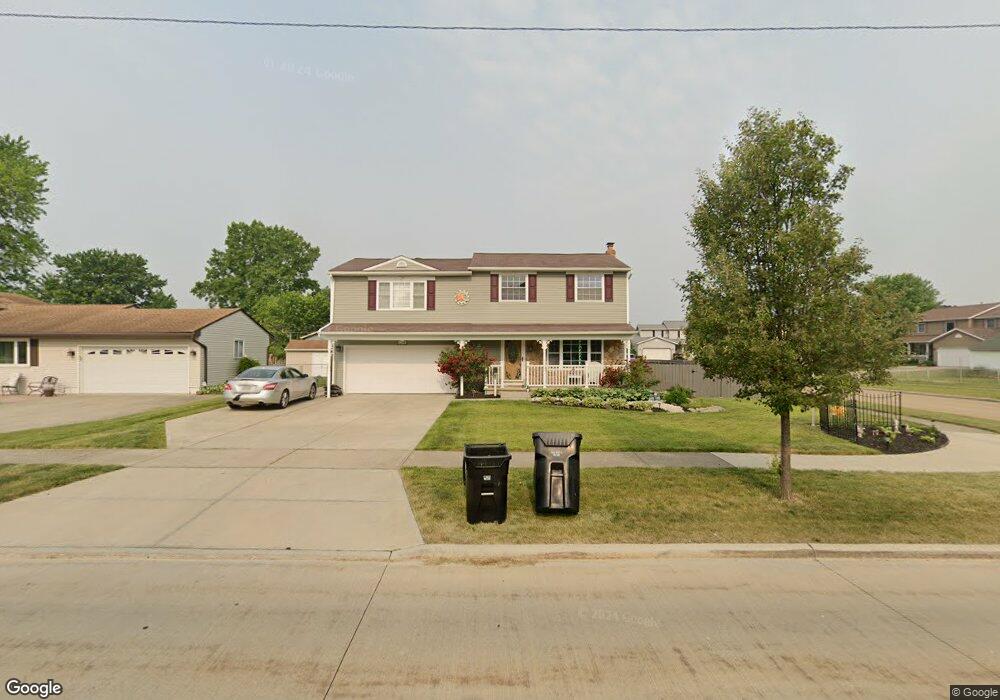
6208 Fry Rd Brookpark, OH 44142
Estimated Value: $250,000 - $335,000
4
Beds
3
Baths
1,790
Sq Ft
$161/Sq Ft
Est. Value
About This Home
This home is located at 6208 Fry Rd, Brookpark, OH 44142 and is currently estimated at $287,367, approximately $160 per square foot. 6208 Fry Rd is a home located in Cuyahoga County with nearby schools including Berea-Midpark Middle School, Berea-Midpark High School, and Huber Heights Preparatory Academy Parma Academy.
Ownership History
Date
Name
Owned For
Owner Type
Purchase Details
Closed on
Aug 4, 2015
Sold by
Donnell Dennis M O
Bought by
Donnell Maureen L O
Current Estimated Value
Purchase Details
Closed on
Nov 15, 1991
Sold by
Bennerkenneth J
Bought by
Zarzeczny Ronald J
Purchase Details
Closed on
Sep 28, 1987
Sold by
Grandinetti Carl P
Bought by
Bennerkenneth J
Purchase Details
Closed on
Apr 20, 1987
Sold by
Gonzalez Genovena
Bought by
Grandinetti Carl P
Purchase Details
Closed on
Oct 15, 1985
Sold by
Gonzalez Miguel A and Gonzalez Genoveva
Bought by
Gonzalez Genovena
Purchase Details
Closed on
Apr 2, 1985
Sold by
Gonzalez Miguel A
Bought by
Gonzalez Miguel A and Gonzalez Genoveva
Purchase Details
Closed on
Sep 6, 1977
Sold by
Clark Richard E and Clark Carolyn A
Bought by
Gonzalez Miguel A
Purchase Details
Closed on
Jan 1, 1975
Bought by
Clark Richard E and Clark Carolyn A
Create a Home Valuation Report for This Property
The Home Valuation Report is an in-depth analysis detailing your home's value as well as a comparison with similar homes in the area
Home Values in the Area
Average Home Value in this Area
Purchase History
| Date | Buyer | Sale Price | Title Company |
|---|---|---|---|
| Donnell Maureen L O | -- | Attorney | |
| Zarzeczny Ronald J | $84,000 | -- | |
| Bennerkenneth J | $71,000 | -- | |
| Grandinetti Carl P | $70,800 | -- | |
| Gonzalez Genovena | -- | -- | |
| Gonzalez Miguel A | -- | -- | |
| Gonzalez Miguel A | $49,500 | -- | |
| Clark Richard E | -- | -- |
Source: Public Records
Tax History Compared to Growth
Tax History
| Year | Tax Paid | Tax Assessment Tax Assessment Total Assessment is a certain percentage of the fair market value that is determined by local assessors to be the total taxable value of land and additions on the property. | Land | Improvement |
|---|---|---|---|---|
| 2024 | $4,407 | $87,360 | $12,425 | $74,935 |
| 2023 | $3,569 | $58,590 | $9,520 | $49,070 |
| 2022 | $3,544 | $58,590 | $9,520 | $49,070 |
| 2021 | $3,523 | $58,590 | $9,520 | $49,070 |
| 2020 | $3,178 | $46,520 | $7,560 | $38,960 |
| 2019 | $3,083 | $132,900 | $21,600 | $111,300 |
| 2018 | $2,911 | $46,520 | $7,560 | $38,960 |
| 2017 | $2,981 | $41,720 | $7,000 | $34,720 |
| 2016 | $2,956 | $41,720 | $7,000 | $34,720 |
| 2015 | $2,922 | $41,720 | $7,000 | $34,720 |
| 2014 | $2,922 | $43,930 | $7,390 | $36,540 |
Source: Public Records
Map
Nearby Homes
- 16051 Holland Rd
- 15924 Richard Dr
- 6054 Langer Dr
- 6363 Lockhaven Dr
- 6378 Edgehurst Dr
- 6470 Sandfield Dr
- 17810 Engle Ct
- 5966 Engle Rd
- 6195 Hardin Dr
- 16193 Emerald Point Unit 16193
- 6537 Liberty Bell Dr Unit 160
- 14890 Holland Rd
- 6577 Liberty Bell Dr Unit 20C
- 15446 Sheldon Rd
- 6728 Benedict Dr
- 6740 Benedict Dr
- 6755 Benedict Dr
- 6401 Scott Dr
- 6710 Woodruff Ct
- 6748 Benedict Dr