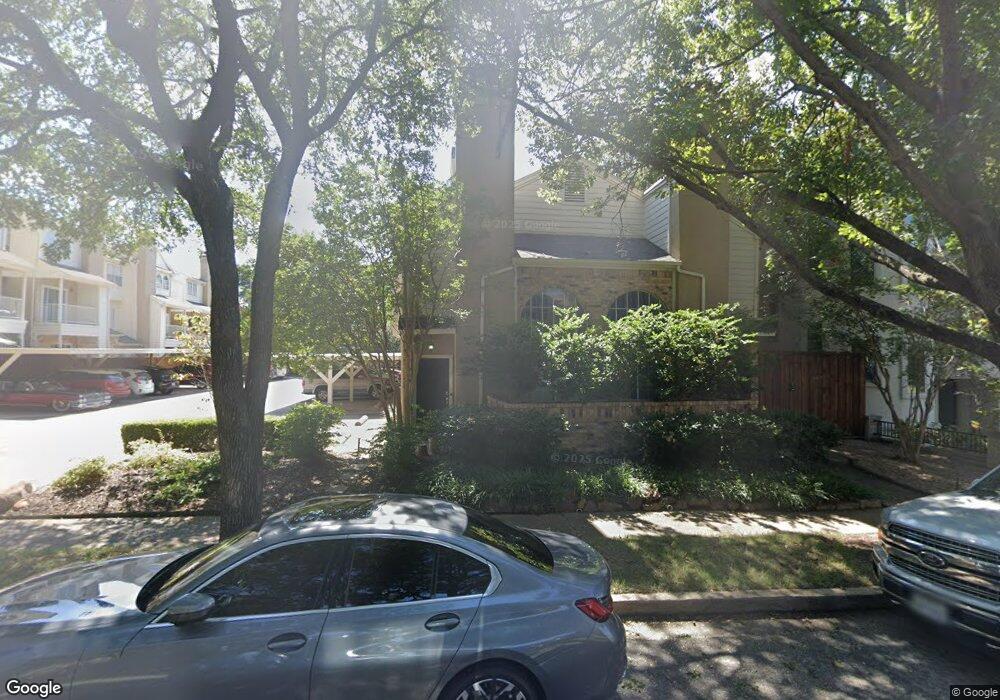
6208 Oram St Unit 13B Dallas, TX 75214
Old East Dallas NeighborhoodEstimated Value: $174,000 - $257,000
1
Bed
1
Bath
641
Sq Ft
$322/Sq Ft
Est. Value
About This Home
This home is located at 6208 Oram St Unit 13B, Dallas, TX 75214 and is currently estimated at $206,634, approximately $322 per square foot. 6208 Oram St Unit 13B is a home located in Dallas County with nearby schools including J L Long Middle School, Woodrow Wilson High School, and Uplift Peak Preparatory High School.
Ownership History
Date
Name
Owned For
Owner Type
Purchase Details
Closed on
Oct 1, 2015
Sold by
Vaca Christian
Bought by
Gump Robert
Current Estimated Value
Home Financials for this Owner
Home Financials are based on the most recent Mortgage that was taken out on this home.
Original Mortgage
$80,000
Outstanding Balance
$32,573
Interest Rate
3.97%
Mortgage Type
New Conventional
Estimated Equity
$174,061
Purchase Details
Closed on
Mar 10, 2005
Sold by
Vaca Humrichouse Ximena G
Bought by
Vaca Christian
Home Financials for this Owner
Home Financials are based on the most recent Mortgage that was taken out on this home.
Original Mortgage
$82,940
Interest Rate
5.67%
Mortgage Type
FHA
Purchase Details
Closed on
Jul 10, 1997
Sold by
Cao Realty Inc
Bought by
Vaca Ximena G
Home Financials for this Owner
Home Financials are based on the most recent Mortgage that was taken out on this home.
Original Mortgage
$38,700
Interest Rate
9.75%
Create a Home Valuation Report for This Property
The Home Valuation Report is an in-depth analysis detailing your home's value as well as a comparison with similar homes in the area
Home Values in the Area
Average Home Value in this Area
Purchase History
| Date | Buyer | Sale Price | Title Company |
|---|---|---|---|
| Gump Robert | -- | Itc | |
| Vaca Christian | -- | -- | |
| Vaca Ximena G | -- | -- |
Source: Public Records
Mortgage History
| Date | Status | Borrower | Loan Amount |
|---|---|---|---|
| Open | Gump Robert | $80,000 | |
| Previous Owner | Vaca Christian | $82,940 | |
| Previous Owner | Vaca Ximena G | $38,700 |
Source: Public Records
Tax History Compared to Growth
Tax History
| Year | Tax Paid | Tax Assessment Tax Assessment Total Assessment is a certain percentage of the fair market value that is determined by local assessors to be the total taxable value of land and additions on the property. | Land | Improvement |
|---|---|---|---|---|
| 2025 | $151 | $201,920 | $60,920 | $141,000 |
| 2024 | $151 | $208,000 | $60,920 | $147,080 |
| 2023 | $151 | $176,280 | $40,620 | $135,660 |
| 2022 | $4,408 | $176,280 | $40,620 | $135,660 |
| 2021 | $4,143 | $157,050 | $35,540 | $121,510 |
| 2020 | $4,261 | $157,050 | $35,540 | $121,510 |
| 2019 | $3,921 | $137,820 | $35,540 | $102,280 |
| 2018 | $2,789 | $102,560 | $30,460 | $72,100 |
| 2017 | $2,562 | $94,230 | $27,420 | $66,810 |
| 2016 | $2,440 | $89,740 | $27,420 | $62,320 |
| 2015 | $1,728 | $82,690 | $22,850 | $59,840 |
| 2014 | $1,728 | $82,690 | $22,850 | $59,840 |
Source: Public Records
Map
Nearby Homes
- 6248 Oram St Unit 6
- 6246 Prospect Ave
- 6006 Swiss Ave
- 6244 Richmond Ave
- 6116 Gaston Ave
- 6038 Prospect Ave
- 6166 Belmont Ave
- 6303 Prospect Ave Unit B104
- 6039 Prospect Ave
- 1844 Mecca St
- 6036 Richmond Ave
- 6318 Richmond Ave Unit 4202D
- 6318 Richmond Ave Unit 4203D
- 6107 Richmond Ave
- 6329 Richmond Ave
- 6333 Richmond Ave Unit D
- 6003 Oram St Unit 104
- 6003 Oram St Unit 106
- 6001 Lewis St
- 6001 Lewis St Unit 102
- 6210 Oram St Unit 9
- 6210 Oram St Unit 5
- 6208 Oram St Unit 19B
- 6210 Oram St Unit 3A
- 6208 Oram St Unit 15B
- 6210 Oram St Unit 8A
- 6210 Oram St Unit 7A
- 6210 Oram St Unit 1A
- 6208 Oram St Unit 14B
- 6208 Oram St Unit 18B
- 6208 Oram St Unit 17B
- 6208 Oram St Unit 12B
- 6208 Oram St Unit 11B
- 6210 Oram St Unit 9A
- 6210 Oram St Unit 5A
- 6210 Oram St Unit 4A
- 6210 Oram St Unit 2A
- 6210 Oram St Unit 8
- 6210 Oram St Unit B
- 6208 Oram St Unit 16