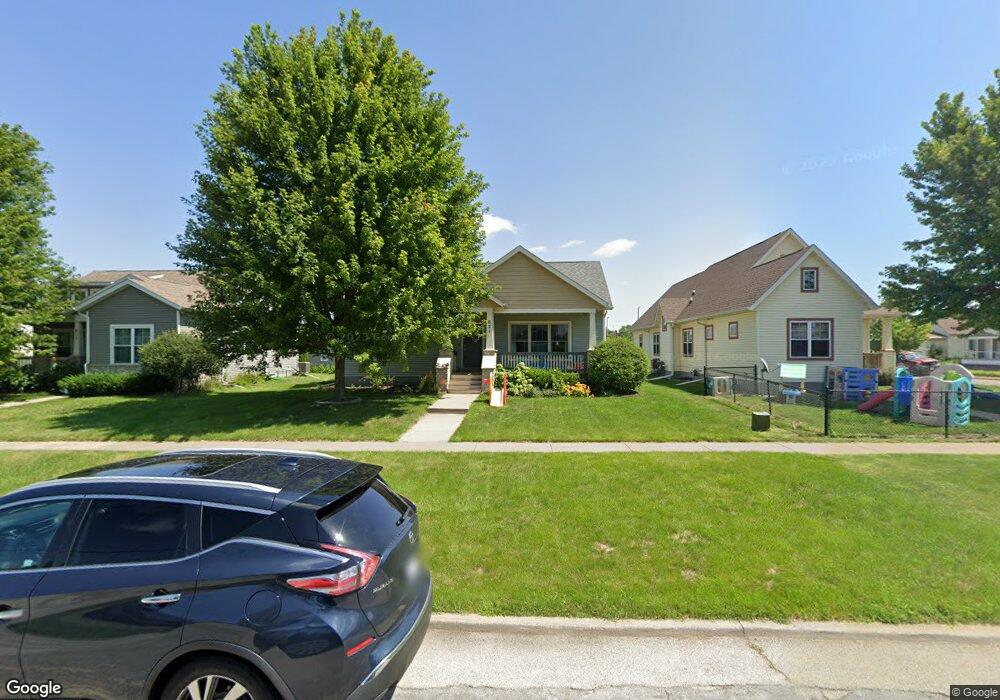
621 10th St Rock Island, IL 61201
Old Town Chicago NeighborhoodEstimated Value: $114,000 - $185,000
--
Bed
--
Bath
1,175
Sq Ft
$117/Sq Ft
Est. Value
About This Home
This home is located at 621 10th St, Rock Island, IL 61201 and is currently estimated at $137,968, approximately $117 per square foot. 621 10th St is a home with nearby schools including Rock Island Academy, Washington Junior High School, and Rock Island High School.
Ownership History
Date
Name
Owned For
Owner Type
Purchase Details
Closed on
Aug 30, 2017
Sold by
Holloway Cory D and Holloway Kristin N
Bought by
Campbell Alexander B and Campbell Kelsey R
Current Estimated Value
Home Financials for this Owner
Home Financials are based on the most recent Mortgage that was taken out on this home.
Original Mortgage
$108,450
Outstanding Balance
$88,894
Interest Rate
3.5%
Mortgage Type
New Conventional
Estimated Equity
$49,074
Create a Home Valuation Report for This Property
The Home Valuation Report is an in-depth analysis detailing your home's value as well as a comparison with similar homes in the area
Home Values in the Area
Average Home Value in this Area
Purchase History
| Date | Buyer | Sale Price | Title Company |
|---|---|---|---|
| Campbell Alexander B | $120,500 | Schwiebert Law Pc |
Source: Public Records
Mortgage History
| Date | Status | Borrower | Loan Amount |
|---|---|---|---|
| Open | Campbell Alexander B | $108,450 | |
| Closed | Campbell Alexander B | $6,935 |
Source: Public Records
Tax History Compared to Growth
Tax History
| Year | Tax Paid | Tax Assessment Tax Assessment Total Assessment is a certain percentage of the fair market value that is determined by local assessors to be the total taxable value of land and additions on the property. | Land | Improvement |
|---|---|---|---|---|
| 2024 | $3,346 | $38,803 | $3,167 | $35,636 |
| 2023 | $3,346 | $37,026 | $3,022 | $34,004 |
| 2022 | $2,857 | $33,539 | $2,838 | $30,701 |
| 2021 | $2,803 | $32,188 | $2,724 | $29,464 |
| 2020 | $2,751 | $31,403 | $2,658 | $28,745 |
| 2019 | $2,749 | $31,403 | $2,658 | $28,745 |
| 2018 | $2,697 | $31,403 | $2,658 | $28,745 |
| 2017 | $2,603 | $30,939 | $2,619 | $28,320 |
| 2016 | $2,498 | $30,333 | $2,568 | $27,765 |
| 2015 | $2,986 | $28,752 | $2,434 | $26,318 |
Source: Public Records
Map
Nearby Homes