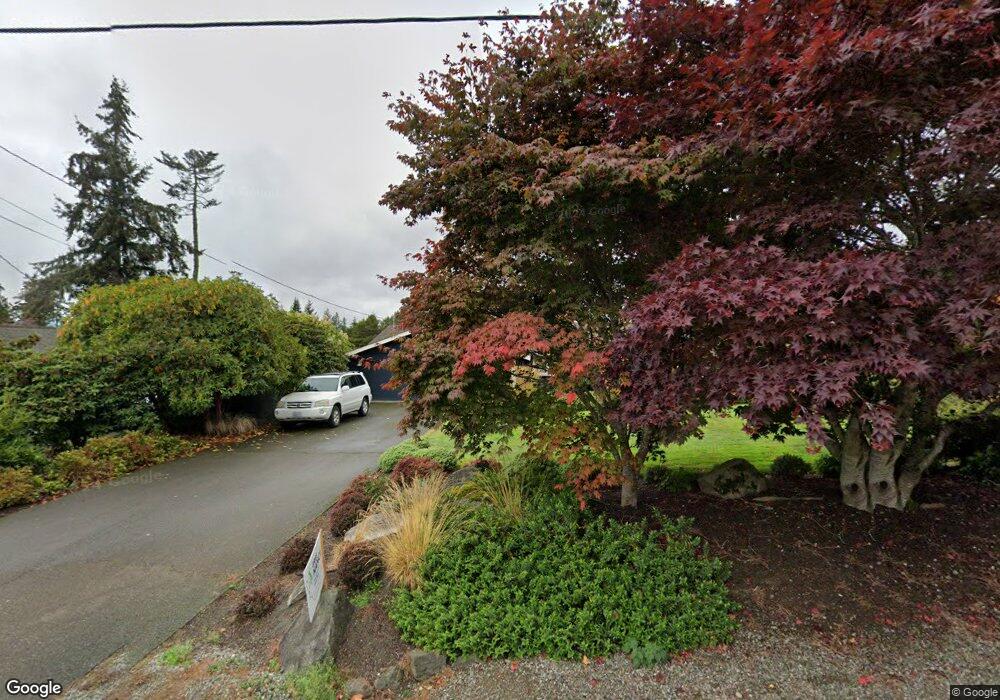
621 Cherry Ave NE Bainbridge Island, WA 98110
Estimated Value: $950,000 - $1,230,000
3
Beds
2
Baths
1,768
Sq Ft
$637/Sq Ft
Est. Value
About This Home
This home is located at 621 Cherry Ave NE, Bainbridge Island, WA 98110 and is currently estimated at $1,126,646, approximately $637 per square foot. 621 Cherry Ave NE is a home located in Kitsap County with nearby schools including Bainbridge High School, Madrona School, and St. Cecilia Catholic School.
Ownership History
Date
Name
Owned For
Owner Type
Purchase Details
Closed on
Jan 10, 2012
Sold by
Us Bank National Association
Bought by
Mackey Doug and Mackey Carla
Current Estimated Value
Purchase Details
Closed on
Aug 9, 2011
Sold by
Snow Patrick E and Snow Cheryl L
Bought by
U S Bank National Association
Purchase Details
Closed on
Sep 15, 2006
Sold by
Obrien Kevin J and Obrien Mary E
Bought by
Snow Patrick E and Snow Cheryl L
Home Financials for this Owner
Home Financials are based on the most recent Mortgage that was taken out on this home.
Original Mortgage
$540,000
Interest Rate
9.8%
Mortgage Type
Balloon
Purchase Details
Closed on
Feb 13, 2001
Sold by
Smith Esther
Bought by
Obrien Kevin J and Obrien Mary E
Home Financials for this Owner
Home Financials are based on the most recent Mortgage that was taken out on this home.
Original Mortgage
$390,000
Interest Rate
7.08%
Create a Home Valuation Report for This Property
The Home Valuation Report is an in-depth analysis detailing your home's value as well as a comparison with similar homes in the area
Home Values in the Area
Average Home Value in this Area
Purchase History
| Date | Buyer | Sale Price | Title Company |
|---|---|---|---|
| Mackey Doug | $315,180 | Fidelity Ntl Of Kitsap Count | |
| U S Bank National Association | $343,434 | Land Title | |
| Snow Patrick E | $560,280 | Stewart Title Of Kitsap C | |
| Obrien Kevin J | $400,000 | Pacific Nw Title |
Source: Public Records
Mortgage History
| Date | Status | Borrower | Loan Amount |
|---|---|---|---|
| Previous Owner | Snow Patrick E | $540,000 | |
| Previous Owner | Obrien Kevin J | $390,000 |
Source: Public Records
Tax History Compared to Growth
Tax History
| Year | Tax Paid | Tax Assessment Tax Assessment Total Assessment is a certain percentage of the fair market value that is determined by local assessors to be the total taxable value of land and additions on the property. | Land | Improvement |
|---|---|---|---|---|
| 2026 | $8,339 | $1,027,420 | $255,180 | $772,240 |
| 2025 | $8,339 | $1,027,420 | $255,180 | $772,240 |
| 2024 | $7,969 | $1,027,420 | $255,180 | $772,240 |
| 2023 | $8,314 | $1,027,430 | $255,190 | $772,240 |
| 2022 | $7,317 | $769,000 | $207,280 | $561,720 |
| 2021 | $6,695 | $669,680 | $180,070 | $489,610 |
| 2020 | $6,371 | $627,650 | $168,410 | $459,240 |
| 2019 | $6,133 | $616,180 | $164,530 | $451,650 |
| 2018 | $6,246 | $488,220 | $129,550 | $358,670 |
| 2017 | $5,134 | $488,220 | $129,550 | $358,670 |
| 2016 | $5,507 | $499,430 | $204,450 | $294,980 |
| 2015 | $4,731 | $436,090 | $178,600 | $257,490 |
| 2014 | -- | $403,500 | $178,600 | $224,900 |
| 2013 | -- | $377,080 | $166,850 | $210,230 |
Source: Public Records
Map
Nearby Homes
- 7268 Madrona Dr NE
- 7551 Madrona Dr NE
- 1237 Hawley Way NE
- 1245 High School Rd NE
- 744 Hanami Ln NE
- 502 Cave Ave NE
- 965 Winslow Way E Unit 104
- 610 NE Vineyard Ln Unit A104
- 752 NE Vineyard Ln Unit L205
- 1314 Polly's Ln
- 511 Groos Ln NE
- Three Story Townhome Plan at Wintergreen Townhomes - Winter Green Townhomes
- 428 Harborview Dr SE Unit 112
- 1349 Nolta Loop NE
- 1341 Nolta Loop NE
- 1339 Nolta Loop NE
- 346 Wyatt Way NE Unit 10
- 465 Winslow Way E Unit 108
- 360 Knechtel Way NE Unit 201
- 300 High School Rd NE Unit 318
- 645 Cherry Ave NE
- 581 Cherry Ave NE
- 701 Cherry Ave NE
- 573 Cherry Ave NE
- 612 Cherry Ave NE
- 721 Cherry Ave NE
- 537 Cherry Ave NE
- 678 Cherry Ave NE
- 652 Cherry Ave NE
- 626 Cherry Ave NE
- 602 Cherry Ave NE
- 712 Cherry Ave NE
- 521 Cherry Ave NE
- 609 Alder Ave NE
- 597 Alder Ave NE
- 530 Cherry Ave NE
- 669 Alder Ave NE
- 722 Cherry Ave NE
- 697 Alder Ave NE