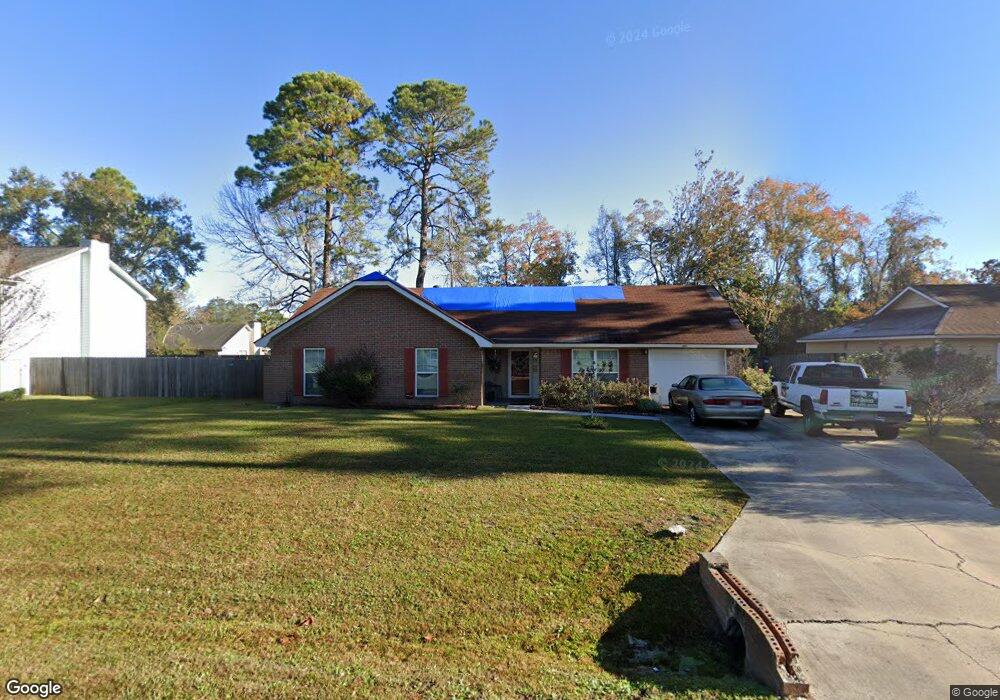
621 Demere St Hinesville, GA 31313
Estimated Value: $214,000 - $229,000
3
Beds
2
Baths
1,440
Sq Ft
$153/Sq Ft
Est. Value
About This Home
This home is located at 621 Demere St, Hinesville, GA 31313 and is currently estimated at $220,663, approximately $153 per square foot. 621 Demere St is a home located in Liberty County with nearby schools including Button Gwinnett Elementary School, Snelson-Golden Middle School, and Bradwell Institute.
Ownership History
Date
Name
Owned For
Owner Type
Purchase Details
Closed on
May 5, 2005
Sold by
Department Of Veteran Affa
Bought by
Riles Janet J
Current Estimated Value
Home Financials for this Owner
Home Financials are based on the most recent Mortgage that was taken out on this home.
Original Mortgage
$71,500
Outstanding Balance
$37,376
Interest Rate
5.88%
Estimated Equity
$183,287
Purchase Details
Closed on
Dec 7, 2004
Sold by
Mortgage Electronic Registration
Bought by
Secretary Of Veterans Affairs
Purchase Details
Closed on
Jul 22, 1999
Sold by
Polo Joann M
Bought by
Bolden Ray C and Bolden Ca
Purchase Details
Closed on
Nov 5, 1998
Sold by
Polo Alvin
Bought by
Polo Joann M
Purchase Details
Closed on
Jun 21, 1998
Sold by
Sec Of Hud
Bought by
Polo Alvin
Purchase Details
Closed on
Mar 8, 1998
Sold by
Norwest Mortgage
Bought by
Sec Of Hud
Create a Home Valuation Report for This Property
The Home Valuation Report is an in-depth analysis detailing your home's value as well as a comparison with similar homes in the area
Home Values in the Area
Average Home Value in this Area
Purchase History
| Date | Buyer | Sale Price | Title Company |
|---|---|---|---|
| Riles Janet J | -- | -- | |
| Secretary Of Veterans Affairs | $66,100 | -- | |
| Mortgage Electronic Registration | $66,100 | -- | |
| Bolden Ray C | $66,400 | -- | |
| Polo Joann M | -- | -- | |
| Polo Alvin | -- | -- | |
| Sec Of Hud | -- | -- | |
| Norwest Mortgage | $81,800 | -- |
Source: Public Records
Mortgage History
| Date | Status | Borrower | Loan Amount |
|---|---|---|---|
| Open | Riles Janet J | $71,500 | |
| Closed | Riles Janet J | $7,500 |
Source: Public Records
Tax History Compared to Growth
Tax History
| Year | Tax Paid | Tax Assessment Tax Assessment Total Assessment is a certain percentage of the fair market value that is determined by local assessors to be the total taxable value of land and additions on the property. | Land | Improvement |
|---|---|---|---|---|
| 2024 | $1,858 | $72,530 | $14,000 | $58,530 |
| 2023 | $1,858 | $63,810 | $12,000 | $51,810 |
| 2022 | $1,460 | $51,574 | $9,200 | $42,374 |
| 2021 | $1,916 | $47,455 | $9,200 | $38,255 |
| 2020 | $1,894 | $45,792 | $9,200 | $36,592 |
| 2019 | $1,850 | $46,293 | $9,200 | $37,093 |
| 2018 | $1,815 | $46,293 | $9,200 | $37,093 |
| 2017 | $1,541 | $46,794 | $9,200 | $37,594 |
| 2016 | $1,682 | $46,794 | $9,200 | $37,594 |
| 2015 | $1,658 | $40,976 | $6,800 | $34,176 |
| 2014 | $1,658 | $44,153 | $8,800 | $35,353 |
| 2013 | -- | $40,591 | $8,800 | $31,791 |
Source: Public Records
Map
Nearby Homes
- 619 Demere St
- 616 Trevor St
- 618 Trevor St
- 614 Trevor St
- 625 Demere St
- 617 Demere St
- 620 Demere St
- 622 Demere St
- 0 Trevor St Unit 8304896
- 0 Trevor St Unit 7604090
- 0 Trevor St Unit 8136585
- 0 Trevor St
- 612 Trevor St Unit n/a
- 612 Trevor St
- 618 Demere St
- 624 Demere St
- 627 Demere St
- 615 Demere St
- 622 Trevor St
- 616 Demere St