Estimated Value: $204,000 - $211,000
About This Home
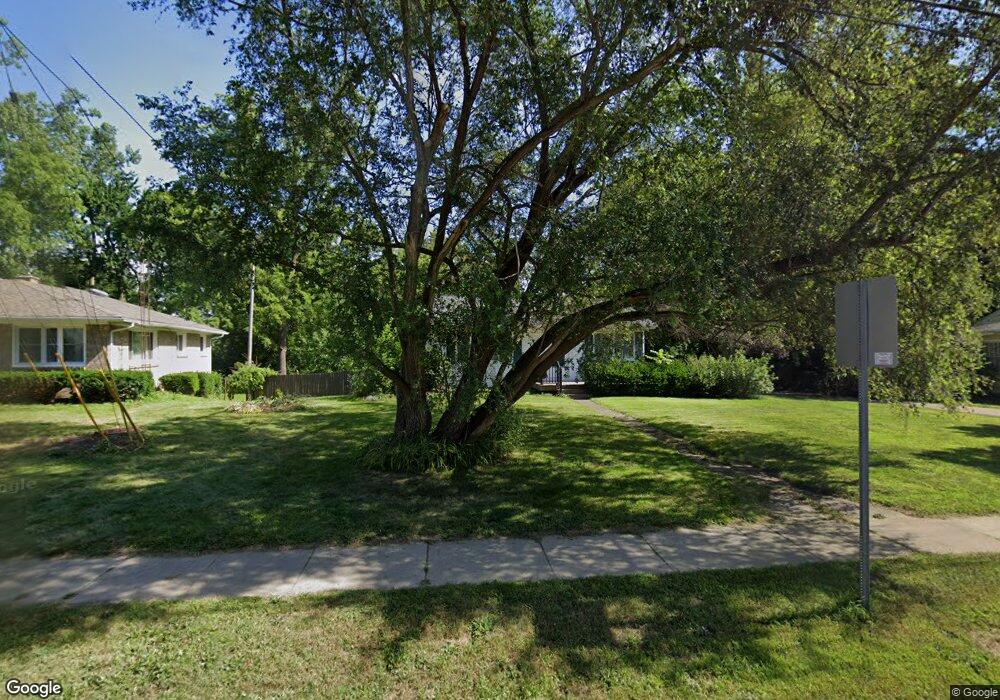
This home is located at 621 E Ash St, Mason, MI 48854 and is currently estimated at $205,930, approximately $147 per square foot. 621 E Ash St is a home located in Ingham County with nearby schools including Mason High School.
Ownership History
We collect this data history from publicly available records. To have your information removed, we recommend requesting removal directly through your county’s website.
Purchase Details
Home Financials for this Owner
Home Financials are based on the most recent Mortgage that was taken out on this home.Purchase Details
Purchase Details
Home Values in the Area
Average Home Value in this Area
Purchase History
We collect this data history from publicly available records. To have your information removed, we recommend requesting removal directly through your county’s website.
| Date | Buyer | Sale Price | Title Company |
|---|---|---|---|
| $126,500 | Tri Title Agency Llc | ||
| $66,700 | -- | ||
| $57,500 | -- |
Mortgage History
We collect this data history from publicly available records. To have your information removed, we recommend requesting removal directly through your county’s website.
| Date | Status | Borrower | Loan Amount |
|---|---|---|---|
| Open | $129,081 |
Tax History
We collect this data history from publicly available records. To have your information removed, we recommend requesting removal directly through your county’s website.
| Year | Tax Paid | Tax Assessment Tax Assessment Total Assessment is a certain percentage of the fair market value that is determined by local assessors to be the total taxable value of land and additions on the property. | Land | Improvement |
|---|---|---|---|---|
| 2025 | $2,575 | $101,720 | $57,610 | $44,110 |
| 2024 | $3,162 | $102,480 | $57,610 | $44,870 |
| 2023 | $3,162 | $87,160 | $48,970 | $38,190 |
| 2022 | $3,017 | $73,660 | $40,330 | $33,330 |
| 2021 | $2,956 | $71,570 | $40,330 | $31,240 |
| 2020 | $2,840 | $68,540 | $40,330 | $28,210 |
| 2019 | $2,748 | $53,240 | $20,160 | $33,080 |
| 2018 | $2,699 | $48,240 | $15,270 | $32,970 |
| 2017 | $2,450 | $48,240 | $15,270 | $32,970 |
| 2016 | -- | $51,990 | $17,280 | $34,710 |
| 2015 | -- | $47,110 | $34,565 | $12,545 |
| 2014 | -- | $51,950 | $48,967 | $2,983 |
Map
- 803 Roosevelt St
- 416 E Maple St
- 567 E South St
- 424 E Columbia St
- 803 Wildemere Dr
- 110 Stratford Dr
- 921 E Columbia St
- 202 Stratford Dr
- 333 W Bailey Cir Unit 2
- 32 Aviemore Dr Unit 32
- 0 Sanctuary
- 27 Aviemore Dr Unit 27
- 305 W Elm St
- 202 Mable Ct
- 427 Center St
- 529 W Ash St
- 615 Center St
- 820 Warner Ave Unit 820822
- 741 Center St
- 965 Franklin Farm Dr
Ask me questions while you tour the home.