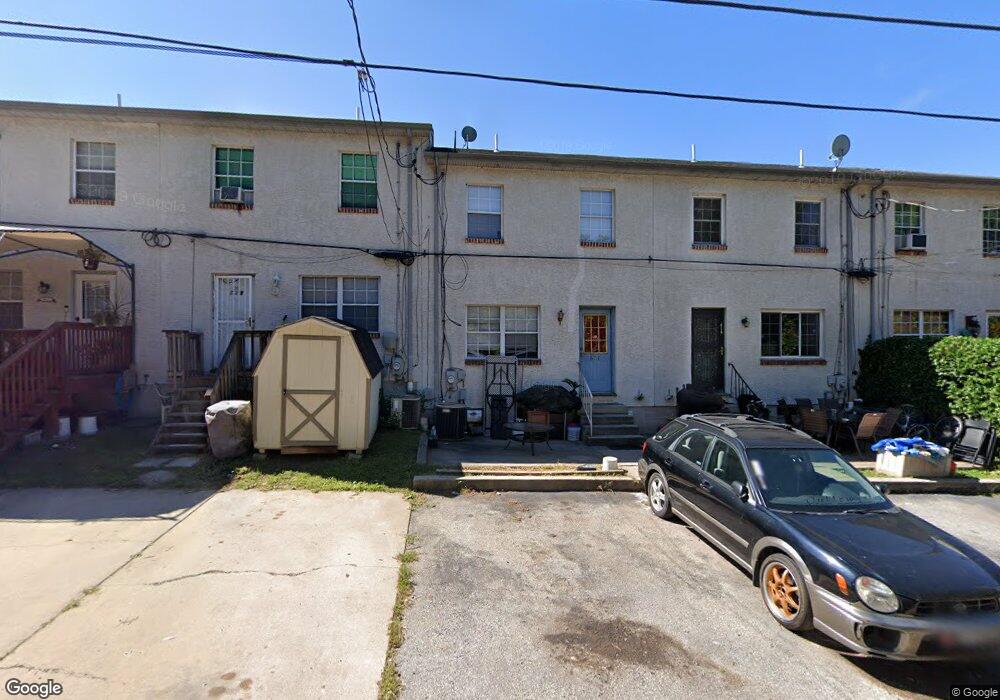
621 E Basin St Norristown, PA 19401
Estimated Value: $207,000 - $274,856
3
Beds
2
Baths
1,440
Sq Ft
$174/Sq Ft
Est. Value
About This Home
This home is located at 621 E Basin St, Norristown, PA 19401 and is currently estimated at $250,285, approximately $173 per square foot. 621 E Basin St is a home located in Montgomery County with nearby schools including Hancock Elementary School, Charles Blockson Middle School, and East Norriton Middle School.
Ownership History
Date
Name
Owned For
Owner Type
Purchase Details
Closed on
May 30, 2007
Sold by
Hud
Bought by
Derro Giuseppe
Current Estimated Value
Purchase Details
Closed on
Jan 30, 2007
Sold by
Midfirst Bank
Bought by
Hud
Purchase Details
Closed on
Dec 29, 2006
Sold by
Johnson Brandon
Bought by
Midfirst Bank
Purchase Details
Closed on
Jan 7, 2000
Sold by
The Petrillo Group
Bought by
Johnson Brandon
Purchase Details
Closed on
Dec 21, 1999
Sold by
Hud and Kay Nancy
Bought by
The Petrillo Group
Purchase Details
Closed on
Mar 5, 1999
Sold by
Homeside Lending Inc
Bought by
Hud
Create a Home Valuation Report for This Property
The Home Valuation Report is an in-depth analysis detailing your home's value as well as a comparison with similar homes in the area
Home Values in the Area
Average Home Value in this Area
Purchase History
| Date | Buyer | Sale Price | Title Company |
|---|---|---|---|
| Derro Giuseppe | $92,000 | None Available | |
| Hud | -- | None Available | |
| Midfirst Bank | $1,608 | None Available | |
| Johnson Brandon | $85,000 | -- | |
| The Petrillo Group | $52,110 | -- | |
| Hud | $1,581 | -- |
Source: Public Records
Tax History Compared to Growth
Tax History
| Year | Tax Paid | Tax Assessment Tax Assessment Total Assessment is a certain percentage of the fair market value that is determined by local assessors to be the total taxable value of land and additions on the property. | Land | Improvement |
|---|---|---|---|---|
| 2025 | $5,856 | $95,390 | $29,280 | $66,110 |
| 2024 | $5,856 | $95,390 | $29,280 | $66,110 |
| 2023 | $5,803 | $95,390 | $29,280 | $66,110 |
| 2022 | $5,677 | $95,390 | $29,280 | $66,110 |
| 2021 | $5,650 | $95,390 | $29,280 | $66,110 |
| 2020 | $5,390 | $95,390 | $29,280 | $66,110 |
| 2019 | $5,291 | $95,390 | $29,280 | $66,110 |
| 2018 | $3,522 | $95,390 | $29,280 | $66,110 |
| 2017 | $4,859 | $95,390 | $29,280 | $66,110 |
| 2016 | $4,821 | $95,390 | $29,280 | $66,110 |
| 2015 | $4,619 | $95,390 | $29,280 | $66,110 |
| 2014 | $4,619 | $95,390 | $29,280 | $66,110 |
Source: Public Records
Map
Nearby Homes