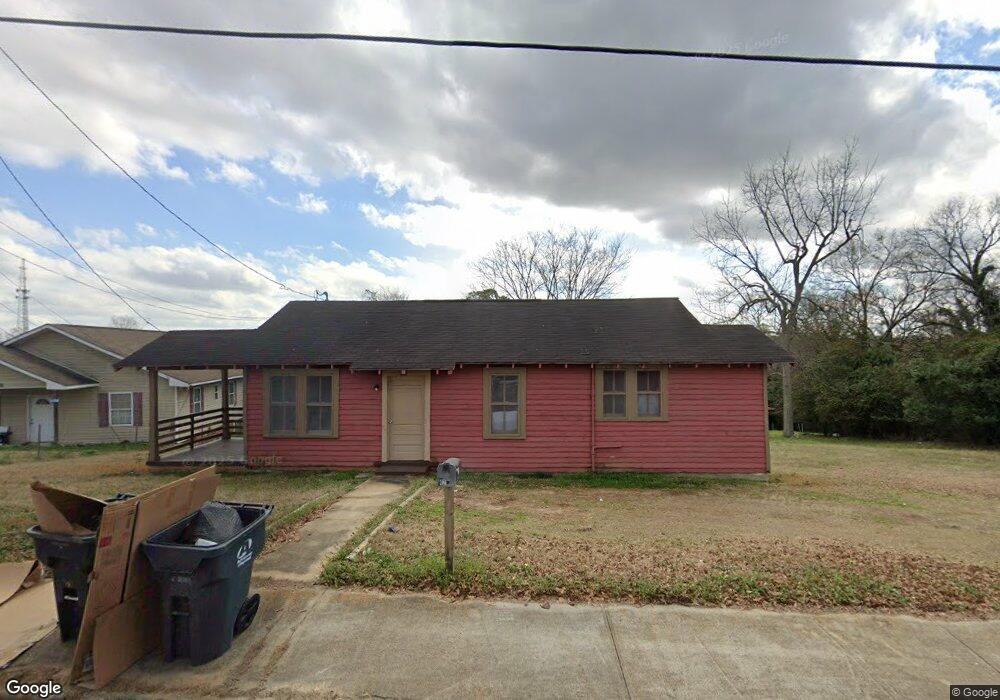
621 E Jefferson St Americus, GA 31709
Estimated Value: $56,000 - $69,292
3
Beds
1
Bath
892
Sq Ft
$70/Sq Ft
Est. Value
About This Home
This home is located at 621 E Jefferson St, Americus, GA 31709 and is currently estimated at $62,573, approximately $70 per square foot. 621 E Jefferson St is a home located in Sumter County with nearby schools including Sumter County Primary School, Sumter County Elementary School, and Sumter County Middle School.
Ownership History
Date
Name
Owned For
Owner Type
Purchase Details
Closed on
Sep 1, 2009
Sold by
Vj Manner Llc
Bought by
Anp Smith Properties Llc
Current Estimated Value
Purchase Details
Closed on
Aug 22, 2005
Sold by
Tyler Waymon
Bought by
V J Wanner Llc
Home Financials for this Owner
Home Financials are based on the most recent Mortgage that was taken out on this home.
Original Mortgage
$22,633
Interest Rate
5.64%
Mortgage Type
New Conventional
Purchase Details
Closed on
Sep 20, 2000
Sold by
Wheatley Realty Co
Bought by
Tyler Mariann Etal
Purchase Details
Closed on
Sep 24, 1996
Sold by
Wheatley C H
Bought by
Wheatley Realty Co
Purchase Details
Closed on
Oct 1, 1934
Bought by
Wheatley C H
Create a Home Valuation Report for This Property
The Home Valuation Report is an in-depth analysis detailing your home's value as well as a comparison with similar homes in the area
Purchase History
| Date | Buyer | Sale Price | Title Company |
|---|---|---|---|
| Anp Smith Properties Llc | $15,600 | -- | |
| V J Wanner Llc | $22,000 | -- | |
| Tyler Mariann Etal | $18,500 | -- | |
| Wheatley Realty Co | -- | -- | |
| Wheatley C H | -- | -- |
Source: Public Records
Mortgage History
| Date | Status | Borrower | Loan Amount |
|---|---|---|---|
| Previous Owner | V J Wanner Llc | $22,633 |
Source: Public Records
Tax History
| Year | Tax Paid | Tax Assessment Tax Assessment Total Assessment is a certain percentage of the fair market value that is determined by local assessors to be the total taxable value of land and additions on the property. | Land | Improvement |
|---|---|---|---|---|
| 2025 | $397 | $8,800 | $2,600 | $6,200 |
| 2024 | $397 | $8,800 | $2,600 | $6,200 |
| 2023 | $388 | $8,800 | $2,600 | $6,200 |
| 2022 | $266 | $8,800 | $2,600 | $6,200 |
| 2021 | $389 | $8,800 | $2,600 | $6,200 |
| 2020 | $398 | $8,800 | $2,600 | $6,200 |
| 2019 | $421 | $8,800 | $2,600 | $6,200 |
| 2018 | $277 | $8,800 | $2,600 | $6,200 |
| 2017 | $277 | $8,800 | $2,600 | $6,200 |
| 2016 | $389 | $8,800 | $2,600 | $6,200 |
| 2015 | $348 | $11,360 | $2,600 | $8,760 |
| 2014 | $348 | $11,360 | $2,600 | $8,760 |
| 2013 | -- | $11,360 | $2,600 | $8,760 |
Source: Public Records
Map
Nearby Homes
- 333 Academy St
- 525 Ashby St
- 433 Mayo St
- 621 E Church St
- 211 Horne St
- 305 E Church St
- 316 Taylor St
- Lots 5 6 13 14 Hwy 49n
- 604 A-C Ga Hwy 49s
- 253 Ga Hwy 27e
- 909 Hwy E Ga Hwy 27e
- 501 Varsity Dr
- 1720 E Lamar St
- 1302 Crawford St
- 518 E Furlow St
- 620 E Furlow St
- 214 Lorraine Ave
- 213 Mitchell St
- 501 S Lee St
- 522 S Lee St
- 617 E Jefferson St
- 718 Oglethorpe Ave
- 615 E Jefferson St
- 618 E Jefferson St
- 616 E Jefferson St
- 614 E Jefferson St
- 710 Oglethorpe Ave
- 306 Pine St
- 708 Oglethorpe Ave
- 405 Academy St
- 606 E Jefferson St
- 706 Oglethorpe Ave
- 403 Academy St Unit AB
- 602 E Jefferson St
- 705 Oglethorpe Ave
- 408 Academy St
- 401 Academy St Unit AB
- 543 E Jefferson St
- 602 Academy St
- 630 Oglethorpe Ave
Your Personal Tour Guide
Ask me questions while you tour the home.