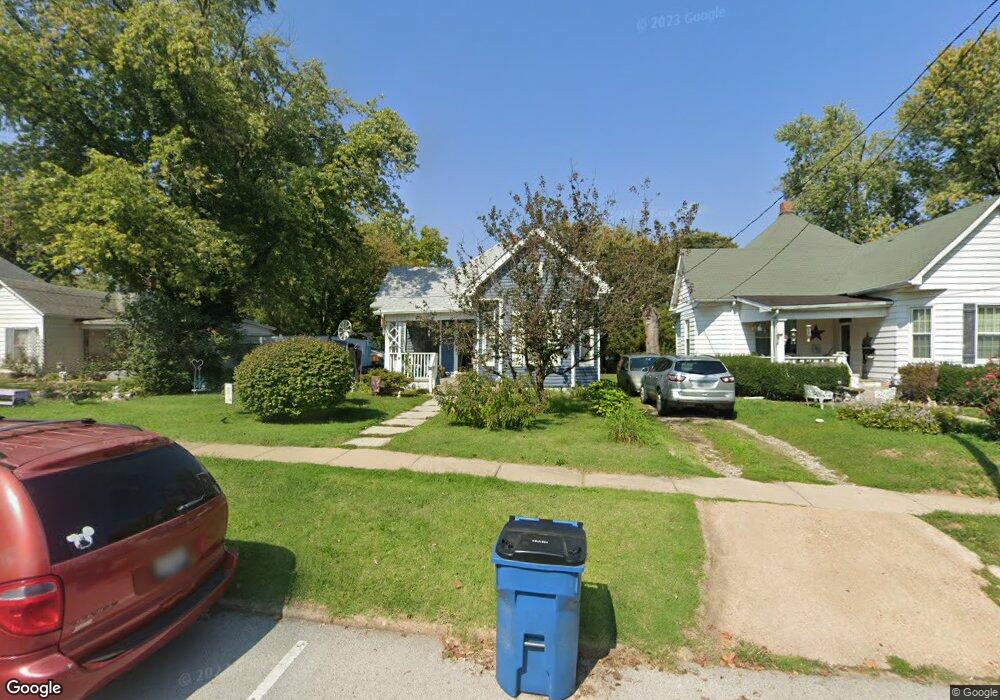
621 E Main St Collinsville, IL 62234
Estimated Value: $140,000 - $162,013
3
Beds
1
Bath
1,431
Sq Ft
$106/Sq Ft
Est. Value
About This Home
This home is located at 621 E Main St, Collinsville, IL 62234 and is currently estimated at $151,503, approximately $105 per square foot. 621 E Main St is a home located in Madison County with nearby schools including Webster Elementary School, Dorris Intermediate School, and Collinsville Middle School.
Ownership History
Date
Name
Owned For
Owner Type
Purchase Details
Closed on
Nov 25, 2008
Sold by
Wells Fargo Bank Na
Bought by
Recklein Heidi
Current Estimated Value
Purchase Details
Closed on
Feb 11, 2008
Sold by
Hill Shane S
Bought by
Wells Fargo Bank Na and Securitized Asset Back Receivables Llc T
Purchase Details
Closed on
Mar 1, 2006
Sold by
Liggett Fred
Bought by
Hill Shane S and Kearns Sandra
Home Financials for this Owner
Home Financials are based on the most recent Mortgage that was taken out on this home.
Original Mortgage
$105,825
Interest Rate
9.97%
Mortgage Type
Purchase Money Mortgage
Purchase Details
Closed on
Dec 18, 2003
Sold by
Kumke Harold and Kumke Maureen D
Bought by
Kumke Thomas and Kumke Wendy
Home Financials for this Owner
Home Financials are based on the most recent Mortgage that was taken out on this home.
Original Mortgage
$63,200
Interest Rate
8.23%
Mortgage Type
New Conventional
Create a Home Valuation Report for This Property
The Home Valuation Report is an in-depth analysis detailing your home's value as well as a comparison with similar homes in the area
Home Values in the Area
Average Home Value in this Area
Purchase History
| Date | Buyer | Sale Price | Title Company |
|---|---|---|---|
| Recklein Heidi | $46,500 | Ultimate Title | |
| Wells Fargo Bank Na | -- | None Available | |
| Hill Shane S | $124,500 | Benchmark Title Company | |
| Kumke 621 East Main Street Land Trust | -- | Benchmark Title Company | |
| Kumke Thomas | $118,500 | Real Title Service Corp |
Source: Public Records
Mortgage History
| Date | Status | Borrower | Loan Amount |
|---|---|---|---|
| Previous Owner | Hill Shane S | $105,825 | |
| Previous Owner | Kumke Thomas | $63,200 |
Source: Public Records
Tax History Compared to Growth
Tax History
| Year | Tax Paid | Tax Assessment Tax Assessment Total Assessment is a certain percentage of the fair market value that is determined by local assessors to be the total taxable value of land and additions on the property. | Land | Improvement |
|---|---|---|---|---|
| 2024 | $1,999 | $39,270 | $7,200 | $32,070 |
| 2023 | $1,999 | $36,340 | $6,660 | $29,680 |
| 2022 | $1,997 | $32,550 | $5,960 | $26,590 |
| 2021 | $1,560 | $30,580 | $5,600 | $24,980 |
| 2020 | $1,478 | $29,170 | $5,340 | $23,830 |
| 2019 | $1,420 | $28,180 | $5,160 | $23,020 |
| 2018 | $1,531 | $26,950 | $4,870 | $22,080 |
| 2017 | $1,524 | $26,410 | $4,770 | $21,640 |
| 2016 | $1,595 | $26,410 | $4,770 | $21,640 |
| 2015 | $1,477 | $25,730 | $4,650 | $21,080 |
| 2014 | $1,477 | $25,730 | $4,650 | $21,080 |
| 2013 | $1,477 | $25,730 | $4,650 | $21,080 |
Source: Public Records
Map
Nearby Homes
- 404 E Church St
- 238 Mill St
- 921 Prospect St
- 110 E Church St
- 315 Meister St
- 413 E Wickliffe Ave
- 501 Spring
- 504 S South Morrison Ave Ave
- 121 S Seminary St
- 123 W Wickliffe Ave
- 444 S Clinton St
- 419 Bell St
- 1006 Vandalia St
- 308 Brown Ave
- 107 S Guernsey St
- 506 W Clay St
- 580 N Guernsey St
- 0 Strong Ave
- 116 N Hesperia St Unit 1
- 0 Elm St