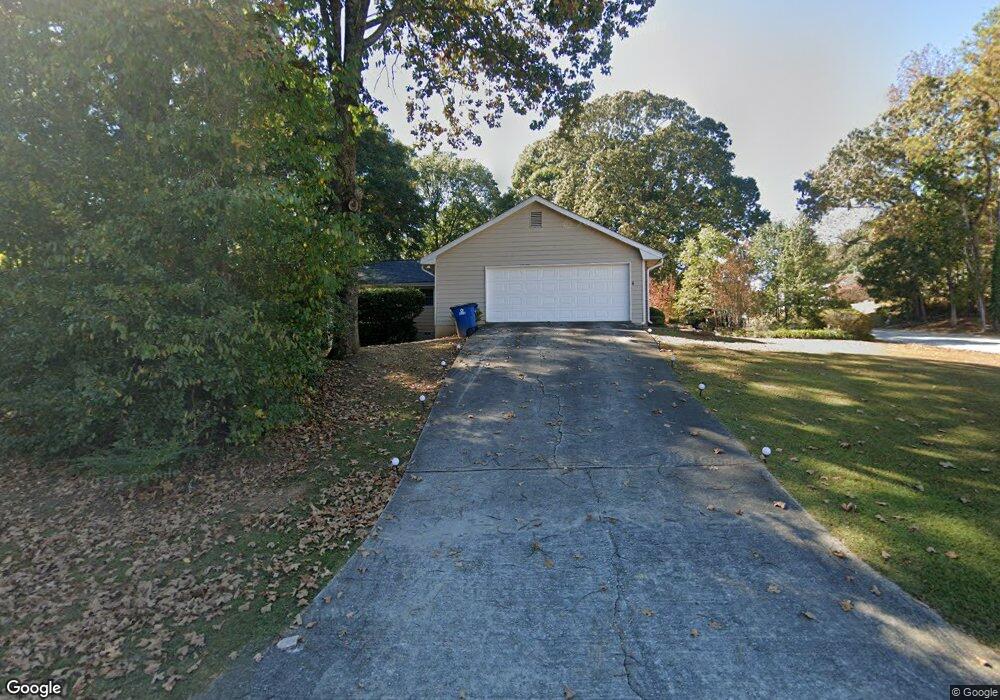
621 Greenview Ave SE Unit 1 Conyers, GA 30094
Estimated Value: $221,000 - $260,000
3
Beds
2
Baths
1,711
Sq Ft
$142/Sq Ft
Est. Value
About This Home
This home is located at 621 Greenview Ave SE Unit 1, Conyers, GA 30094 and is currently estimated at $242,899, approximately $141 per square foot. 621 Greenview Ave SE Unit 1 is a home located in Rockdale County with nearby schools including Sims Elementary School, Edwards Middle School, and Heritage High School.
Ownership History
Date
Name
Owned For
Owner Type
Purchase Details
Closed on
May 9, 2017
Sold by
Not Provided
Bought by
Srp Sub Llc
Current Estimated Value
Purchase Details
Closed on
Jan 31, 2014
Sold by
Srp Sub Llc
Bought by
Tarbert Llc
Purchase Details
Closed on
Oct 1, 2013
Sold by
Martinez Alejandro
Bought by
Srp Sub Llc
Purchase Details
Closed on
May 4, 2001
Sold by
Martinez Alejandro
Bought by
Martinez Alejandro and Martinez Leticia
Home Financials for this Owner
Home Financials are based on the most recent Mortgage that was taken out on this home.
Original Mortgage
$98,353
Interest Rate
7.11%
Mortgage Type
FHA
Purchase Details
Closed on
May 14, 1998
Sold by
Holland Donald V
Bought by
Hull James L
Home Financials for this Owner
Home Financials are based on the most recent Mortgage that was taken out on this home.
Original Mortgage
$68,800
Interest Rate
7.1%
Mortgage Type
New Conventional
Create a Home Valuation Report for This Property
The Home Valuation Report is an in-depth analysis detailing your home's value as well as a comparison with similar homes in the area
Home Values in the Area
Average Home Value in this Area
Purchase History
| Date | Buyer | Sale Price | Title Company |
|---|---|---|---|
| Srp Sub Llc | -- | -- | |
| Tarbert Llc | -- | -- | |
| Srp Sub Llc | $27,500 | -- | |
| Martinez Alejandro | -- | -- | |
| Martinez Alejandro | $99,900 | -- | |
| Hull James L | $86,000 | -- |
Source: Public Records
Mortgage History
| Date | Status | Borrower | Loan Amount |
|---|---|---|---|
| Previous Owner | Martinez Alejandro | $98,353 | |
| Previous Owner | Hull James L | $68,800 |
Source: Public Records
Tax History Compared to Growth
Tax History
| Year | Tax Paid | Tax Assessment Tax Assessment Total Assessment is a certain percentage of the fair market value that is determined by local assessors to be the total taxable value of land and additions on the property. | Land | Improvement |
|---|---|---|---|---|
| 2024 | $3,904 | $97,960 | $18,480 | $79,480 |
| 2023 | $3,046 | $73,880 | $12,800 | $61,080 |
| 2022 | $2,570 | $61,880 | $12,800 | $49,080 |
| 2021 | $2,101 | $50,720 | $8,960 | $41,760 |
| 2020 | $1,962 | $46,040 | $8,600 | $37,440 |
| 2019 | $1,345 | $29,960 | $4,680 | $25,280 |
| 2018 | $1,351 | $29,960 | $4,680 | $25,280 |
| 2017 | $1,214 | $26,680 | $4,680 | $22,000 |
| 2016 | $1,214 | $26,680 | $4,680 | $22,000 |
| 2015 | $1,367 | $30,000 | $4,680 | $25,320 |
| 2014 | $506 | $11,000 | $1,384 | $9,616 |
| 2013 | -- | $28,880 | $4,840 | $24,040 |
Source: Public Records
Map
Nearby Homes
- 693 Deering Rd SE
- 665 Huron Ct SE
- 549 Greenview Ave SE
- 574 Almand Branch Rd SE Unit 1
- 2987 Landmark Dr SE
- 2910 Stanton Rd SE
- 3021 Lakeridge Dr SE
- 2717 Stanton Woods Dr SE
- 3027 Lakeridge Dr SE
- 2851 Stanton Rd SE
- 726 Shoreline Trail SE
- 3014 Lakeridge Dr SE
- 2923 Raintree Dr SE
- 2924 Raintree Dr SE
- 820 Bridgewater Way SE
- 812 Raintree Way SE
- 1813 Holmsey Cir
- 1511 Hillside Dr SE
- 2617 Laurel Woods Ln SE Unit 3
- 1508 Hillside Dr SE
- 611 Greenview Ave SE
- 0 Greenview Ave SE Unit 8598695
- 0 Greenview Ave SE Unit 8581789
- 0 Greenview Ave SE Unit 8573568
- 0 Greenview Ave SE Unit 7551704
- 0 Greenview Ave SE Unit 7145213
- 0 Greenview Ave SE Unit 7092234
- 0 Greenview Ave SE Unit 8951790
- 0 Greenview Ave SE Unit 9005641
- 0 Greenview Ave SE Unit 8800881
- 0 Greenview Ave SE Unit 7048059
- 0 Greenview Ave SE Unit 7309091
- 0 Greenview Ave SE Unit 7324109
- 0 Greenview Ave SE Unit 7381671
- 0 Greenview Ave SE Unit 7386011
- 0 Greenview Ave SE Unit 7499565
- 0 Greenview Ave SE Unit 8245144
- 0 Greenview Ave SE
- 2903 High Brook Way SE
- 631 Greenview Ave SE