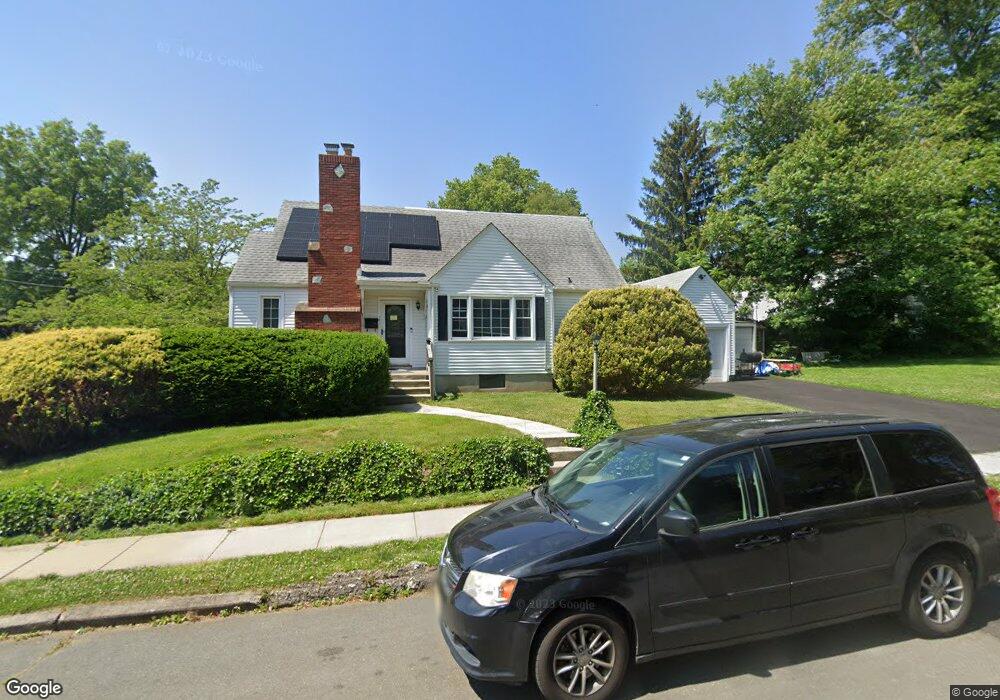
621 Greenway Ave Ewing, NJ 08618
Glendale NeighborhoodEstimated Value: $317,000 - $467,000
--
Bed
--
Bath
1,672
Sq Ft
$235/Sq Ft
Est. Value
About This Home
This home is located at 621 Greenway Ave, Ewing, NJ 08618 and is currently estimated at $392,126, approximately $234 per square foot. 621 Greenway Ave is a home located in Mercer County with nearby schools including Ewing High School and Trenton Stem-To-Civics Charter School.
Ownership History
Date
Name
Owned For
Owner Type
Purchase Details
Closed on
Feb 8, 2023
Sold by
Rivera Jose M
Bought by
Rivera Jose M and Rivera Charity
Current Estimated Value
Home Financials for this Owner
Home Financials are based on the most recent Mortgage that was taken out on this home.
Original Mortgage
$161,782
Outstanding Balance
$156,842
Interest Rate
6.48%
Mortgage Type
FHA
Estimated Equity
$235,284
Purchase Details
Closed on
Aug 29, 2017
Sold by
Pennymac Loan Services Llc
Bought by
Thurton Deborah
Home Financials for this Owner
Home Financials are based on the most recent Mortgage that was taken out on this home.
Original Mortgage
$145,319
Interest Rate
3.87%
Mortgage Type
FHA
Purchase Details
Closed on
May 16, 2016
Sold by
Retirement Plan Stanley Winnick and Winnick Stanley
Bought by
Rivera Jose M
Home Financials for this Owner
Home Financials are based on the most recent Mortgage that was taken out on this home.
Original Mortgage
$137,365
Interest Rate
3.25%
Mortgage Type
FHA
Purchase Details
Closed on
May 28, 2015
Sold by
Freil Katherine M
Bought by
Winnick Stanley
Create a Home Valuation Report for This Property
The Home Valuation Report is an in-depth analysis detailing your home's value as well as a comparison with similar homes in the area
Home Values in the Area
Average Home Value in this Area
Purchase History
| Date | Buyer | Sale Price | Title Company |
|---|---|---|---|
| Rivera Jose M | -- | -- | |
| Thurton Deborah | $148,000 | None Available | |
| Rivera Jose M | $139,900 | Core Title | |
| Winnick Stanley | $57,500 | Core Title |
Source: Public Records
Mortgage History
| Date | Status | Borrower | Loan Amount |
|---|---|---|---|
| Open | Rivera Jose M | $161,782 | |
| Previous Owner | Thurton Deborah | $145,319 | |
| Previous Owner | Rivera Jose M | $137,365 |
Source: Public Records
Tax History Compared to Growth
Tax History
| Year | Tax Paid | Tax Assessment Tax Assessment Total Assessment is a certain percentage of the fair market value that is determined by local assessors to be the total taxable value of land and additions on the property. | Land | Improvement |
|---|---|---|---|---|
| 2025 | $8,845 | $224,900 | $67,600 | $157,300 |
| 2024 | $8,315 | $224,900 | $67,600 | $157,300 |
| 2023 | $8,315 | $224,900 | $67,600 | $157,300 |
| 2022 | $8,090 | $224,900 | $67,600 | $157,300 |
| 2021 | $7,892 | $224,900 | $67,600 | $157,300 |
| 2020 | $7,779 | $224,900 | $67,600 | $157,300 |
| 2019 | $7,577 | $224,900 | $67,600 | $157,300 |
| 2018 | $6,243 | $118,200 | $45,200 | $73,000 |
| 2017 | $6,389 | $118,200 | $45,200 | $73,000 |
| 2016 | $6,302 | $118,200 | $45,200 | $73,000 |
| 2015 | $6,784 | $133,700 | $45,200 | $88,500 |
| 2014 | $6,765 | $133,700 | $45,200 | $88,500 |
Source: Public Records
Map
Nearby Homes
- 643 Concord Cir
- 644 Concord Cir
- 1 Pingree Ct
- 605 Concord Ave
- 310 Pingree Ave
- 442 Vannest Ave
- 768 Parkway Ave
- 1583 Pennington Rd
- 0 Beechwood Dr Unit NJME2058552
- 0 Beechwood Ave
- 7 Pershing Ave
- 318 Beechwood Ave
- 1419 Pennington Rd
- 330 Hillcrest Ave
- 302 Berwyn Ave
- 3 Wallace Ave
- 6 New Hillcrest Ave
- 215 Stacey Ave
- 318 Gardner Ave
- 50 Groveland Ave
- 619 Greenway Ave
- 618 Westmoreland Dr
- 617 Greenway Ave
- 640 Latona Ave
- 622 Greenway Ave
- 638 Latona Ave
- 616 Westmoreland Dr
- 620 Greenway Ave
- 615 Greenway Ave
- 618 Greenway Ave
- 634 Latona Ave
- 644 Latona Ave
- 616 Greenway Ave
- 613 Greenway Ave
- 623 Latona Ave
- 619 Westmoreland Dr
- 612 Westmoreland Dr
- 621 Westmoreland Dr
- 621 Latona Ave
- 617 Westmoreland Dr