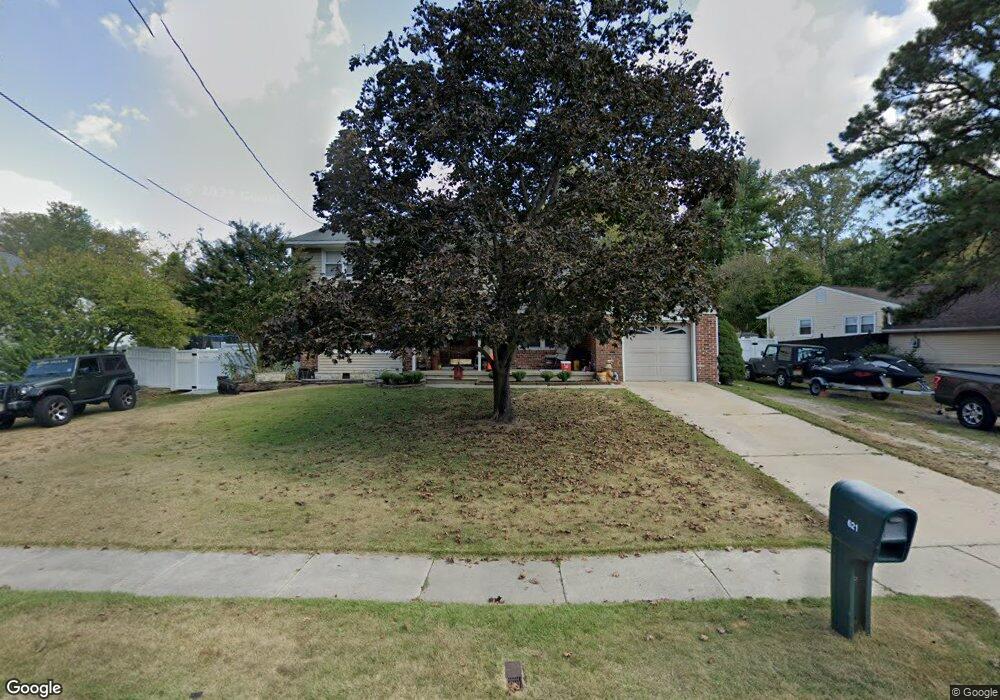
621 Howard Ave Pitman, NJ 08071
Estimated Value: $505,363 - $560,000
Studio
--
Bath
2,285
Sq Ft
$237/Sq Ft
Est. Value
About This Home
This home is located at 621 Howard Ave, Pitman, NJ 08071 and is currently estimated at $541,341, approximately $236 per square foot. 621 Howard Ave is a home located in Gloucester County with nearby schools including W.C.K. Walls Elementary School, Pitman Middle School, and Pitman High School.
Ownership History
Date
Name
Owned For
Owner Type
Purchase Details
Closed on
Jul 26, 2017
Sold by
Grugan Caryl Ann and Conley Patricia J
Bought by
Colney Patricia J and Colney Danny B
Current Estimated Value
Home Financials for this Owner
Home Financials are based on the most recent Mortgage that was taken out on this home.
Original Mortgage
$197,000
Outstanding Balance
$162,029
Interest Rate
3.88%
Mortgage Type
New Conventional
Estimated Equity
$379,312
Purchase Details
Closed on
Nov 24, 2004
Sold by
Quigley George T and Quigley Susan M
Bought by
Grugan Caryl Ann and Conley Patricia J
Home Financials for this Owner
Home Financials are based on the most recent Mortgage that was taken out on this home.
Original Mortgage
$220,000
Interest Rate
5.37%
Mortgage Type
Purchase Money Mortgage
Create a Home Valuation Report for This Property
The Home Valuation Report is an in-depth analysis detailing your home's value as well as a comparison with similar homes in the area
Home Values in the Area
Average Home Value in this Area
Purchase History
| Date | Buyer | Sale Price | Title Company |
|---|---|---|---|
| Colney Patricia J | -- | None Available | |
| Grugan Caryl Ann | $275,000 | Fidelity National Title |
Source: Public Records
Mortgage History
| Date | Status | Borrower | Loan Amount |
|---|---|---|---|
| Open | Colney Patricia J | $197,000 | |
| Previous Owner | Grugan Caryl Ann | $220,000 |
Source: Public Records
Tax History
| Year | Tax Paid | Tax Assessment Tax Assessment Total Assessment is a certain percentage of the fair market value that is determined by local assessors to be the total taxable value of land and additions on the property. | Land | Improvement |
|---|---|---|---|---|
| 2025 | $11,628 | $332,900 | $61,300 | $271,600 |
| 2024 | $11,322 | $332,900 | $61,300 | $271,600 |
| 2023 | $11,322 | $332,900 | $61,300 | $271,600 |
| 2022 | $10,876 | $332,900 | $61,300 | $271,600 |
| 2021 | $10,634 | $237,200 | $59,700 | $177,500 |
| 2020 | $10,508 | $237,200 | $59,700 | $177,500 |
| 2019 | $10,261 | $237,200 | $59,700 | $177,500 |
| 2018 | $10,088 | $237,200 | $59,700 | $177,500 |
| 2017 | $9,962 | $237,200 | $59,700 | $177,500 |
| 2016 | $9,770 | $237,200 | $59,700 | $177,500 |
| 2015 | $9,507 | $237,200 | $59,700 | $177,500 |
| 2014 | $9,215 | $237,200 | $59,700 | $177,500 |
Source: Public Records
Map
Nearby Homes
- 407 Tuohy Ave
- 198 West Ave
- 315 Lake Ave
- 135 Laurel Ave
- 14 4th Ave
- 349 W Jersey Ave
- 127 W Holly Ave
- 740 Carpenter St
- 119 121 Grandview Ave
- 508 Hudson Ave
- 1040 N Main St
- 603 Hudson Ave
- 205 Adams Ave
- 302 Montgomery Ave
- 302 Washington Ave
- 237 Adams Ave
- 344 Columbia Ave
- 0 Lambs Rd Unit NJGL2048944
- 103 N Brentwood Ave
- 117 Girard Rd N
- 617 Howard Ave
- 625 Howard Ave
- 563 Florence Ave
- 629 Howard Ave
- 567 Florence Ave
- 624 Howard Ave
- 613 Howard Ave
- 628 Howard Ave
- 559 Florence Ave
- 620 Howard Ave
- 632 Howard Ave
- 571 Florence Ave
- 616 Howard Ave
- 633 Howard Ave
- 609 Howard Ave
- 636 Howard Ave
- 555 Florence Ave
- 575 Florence Ave
- 637 Howard Ave
- 640 Howard Ave
Your Personal Tour Guide
Ask me questions while you tour the home.