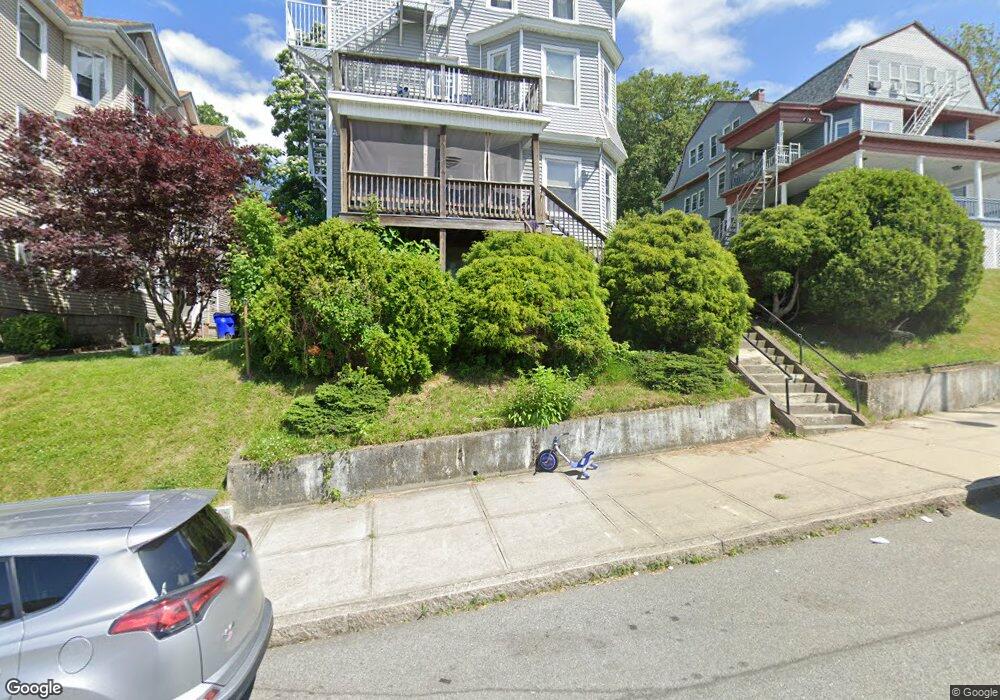
621 June St Fall River, MA 02720
Lower Highlands NeighborhoodEstimated Value: $477,000 - $731,000
9
Beds
3
Baths
3,710
Sq Ft
$172/Sq Ft
Est. Value
About This Home
This home is located at 621 June St, Fall River, MA 02720 and is currently estimated at $639,333, approximately $172 per square foot. 621 June St is a home located in Bristol County with nearby schools including Mary Fonseca Elementary School, Morton Middle School, and B M C Durfee High School.
Ownership History
Date
Name
Owned For
Owner Type
Purchase Details
Closed on
Jul 21, 2023
Sold by
Pires Jose C and Pires Maria F
Bought by
Pires Properties Llc
Current Estimated Value
Purchase Details
Closed on
Aug 26, 2009
Sold by
Sears Richard W and Matthews Kathleen M
Bought by
Pires Jose C and Pires Maria F
Create a Home Valuation Report for This Property
The Home Valuation Report is an in-depth analysis detailing your home's value as well as a comparison with similar homes in the area
Home Values in the Area
Average Home Value in this Area
Purchase History
| Date | Buyer | Sale Price | Title Company |
|---|---|---|---|
| Pires Properties Llc | -- | None Available | |
| Pires Jose C | $120,000 | -- |
Source: Public Records
Tax History
| Year | Tax Paid | Tax Assessment Tax Assessment Total Assessment is a certain percentage of the fair market value that is determined by local assessors to be the total taxable value of land and additions on the property. | Land | Improvement |
|---|---|---|---|---|
| 2025 | $6,665 | $582,100 | $138,100 | $444,000 |
| 2024 | $6,368 | $554,200 | $132,800 | $421,400 |
| 2023 | $5,666 | $461,800 | $114,800 | $347,000 |
| 2022 | $5,025 | $398,200 | $107,400 | $290,800 |
| 2021 | $4,843 | $350,200 | $107,700 | $242,500 |
| 2020 | $4,412 | $305,300 | $107,900 | $197,400 |
| 2019 | $3,874 | $265,700 | $109,600 | $156,100 |
| 2018 | $3,646 | $249,400 | $109,600 | $139,800 |
| 2017 | $3,366 | $240,400 | $100,600 | $139,800 |
| 2016 | $3,228 | $236,800 | $100,600 | $136,200 |
| 2015 | $3,097 | $236,800 | $100,600 | $136,200 |
| 2014 | -- | $243,300 | $93,800 | $149,500 |
Source: Public Records
Map
Nearby Homes
- 11 Dyer St
- 909 High St Unit 1
- 889 High St
- 771 Rock St
- 327 Brownell St
- 267 Lincoln Ave
- 33-35 Malvey St
- 10 N Court St Unit 3
- 72 Belmont St
- 750 Davol St Unit 321
- 750 Davol St Unit 219
- 750 Davol St Unit 221
- 750 Davol St Unit 616
- 750 Davol St Unit 214
- 503 Highland Ave
- 302 Cory St
- 575 N Main St
- 213 Weetamoe St
- 499 Hanover St
- 102 Vestal St
Your Personal Tour Guide
Ask me questions while you tour the home.