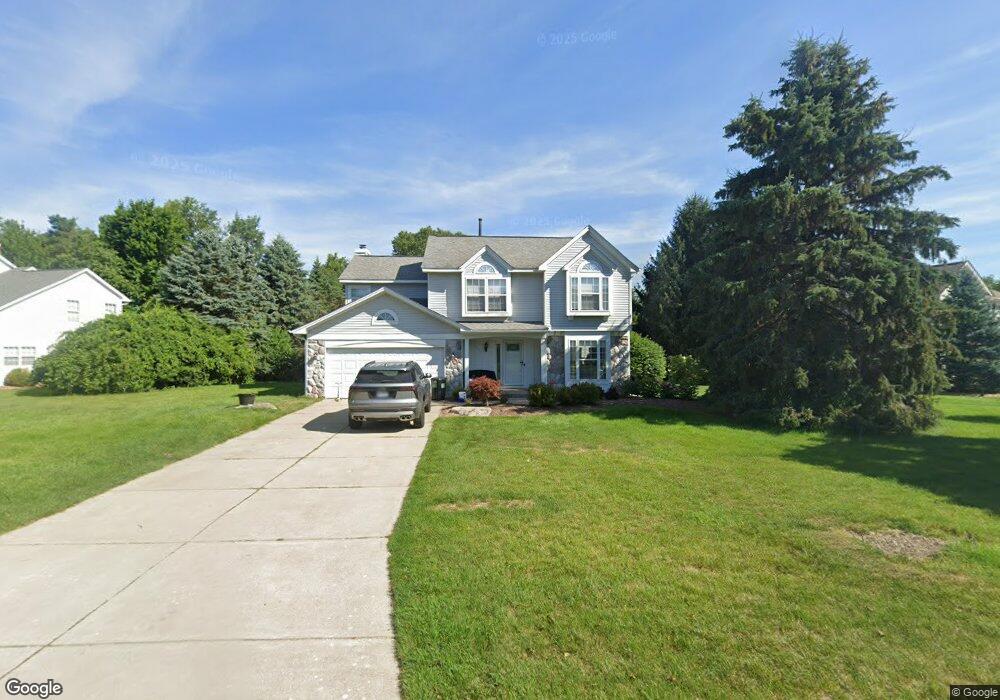
621 Leyland Ct Unit Bldg-Unit Lake Orion, MI 48362
Estimated Value: $514,000 - $541,000
4
Beds
3
Baths
2,287
Sq Ft
$229/Sq Ft
Est. Value
About This Home
This home is located at 621 Leyland Ct Unit Bldg-Unit, Lake Orion, MI 48362 and is currently estimated at $523,914, approximately $229 per square foot. 621 Leyland Ct Unit Bldg-Unit is a home located in Oakland County with nearby schools including Paint Creek Elementary School, Scripps Middle School, and Lake Orion Community High School.
Ownership History
Date
Name
Owned For
Owner Type
Purchase Details
Closed on
Dec 19, 2018
Sold by
Kerchner Patricia
Bought by
Hanschu Richard and Hanschu Stephanie
Current Estimated Value
Home Financials for this Owner
Home Financials are based on the most recent Mortgage that was taken out on this home.
Original Mortgage
$305,900
Outstanding Balance
$270,042
Interest Rate
4.9%
Mortgage Type
New Conventional
Estimated Equity
$253,872
Purchase Details
Closed on
Jul 28, 2005
Sold by
Loden Timothy J and Perham Loden Ann
Bought by
National Transfer Services Llc
Purchase Details
Closed on
Jul 25, 2005
Sold by
National Transfer Services Llc
Bought by
Kerchner Patricia
Purchase Details
Closed on
Nov 10, 2003
Sold by
Hull Michael K and Hull Paulette M
Bought by
Loden Timothy J and Perham Loden Ann
Purchase Details
Closed on
Apr 9, 1996
Sold by
Holtzman Silverman Const
Bought by
Silverman Building Co Inc
Create a Home Valuation Report for This Property
The Home Valuation Report is an in-depth analysis detailing your home's value as well as a comparison with similar homes in the area
Home Values in the Area
Average Home Value in this Area
Purchase History
| Date | Buyer | Sale Price | Title Company |
|---|---|---|---|
| Hanschu Richard | $322,000 | Interstate Title Inc | |
| National Transfer Services Llc | $275,000 | Stewart Title Guaranty Co | |
| Kerchner Patricia | $275,000 | Stewart Title Guaranty Co | |
| Loden Timothy J | $315,000 | Title One Inc | |
| Silverman Building Co Inc | $45,000 | -- |
Source: Public Records
Mortgage History
| Date | Status | Borrower | Loan Amount |
|---|---|---|---|
| Open | Hanschu Richard | $305,900 |
Source: Public Records
Tax History Compared to Growth
Tax History
| Year | Tax Paid | Tax Assessment Tax Assessment Total Assessment is a certain percentage of the fair market value that is determined by local assessors to be the total taxable value of land and additions on the property. | Land | Improvement |
|---|---|---|---|---|
| 2024 | $4,247 | $218,620 | $0 | $0 |
| 2023 | $4,052 | $195,220 | $0 | $0 |
| 2022 | $5,715 | $175,140 | $0 | $0 |
| 2021 | $5,454 | $170,720 | $0 | $0 |
| 2020 | $3,713 | $168,030 | $0 | $0 |
| 2019 | $5,051 | $150,660 | $0 | $0 |
| 2018 | $5,168 | $133,250 | $0 | $0 |
| 2017 | $4,979 | $133,250 | $0 | $0 |
| 2016 | $4,952 | $134,350 | $0 | $0 |
| 2015 | -- | $116,710 | $0 | $0 |
| 2014 | -- | $110,040 | $0 | $0 |
| 2011 | -- | $88,250 | $0 | $0 |
Source: Public Records
Map
Nearby Homes
- 693 Knibbe Rd
- 1859 Lonesome Lake Ct
- 468 Orchard Ridge Dr
- 271 Greenan Ln
- 656 Lawson Dr
- 192 Greenan Ln
- 449 Joslyn Rd
- 302 Kirksway Ln
- 84 Greenan Ln
- 1412 Marina Pointe Blvd
- 1906 Indianwood Rd
- 35 N Broadway St
- 2999 Buckner Rd
- 840 Laird St
- 101 N Newman Rd
- 1075 Beach Dr
- 3230 Park Meadow Dr
- 816 Vernita Dr
- 767 Pinery Blvd
- 239 Pine Tree Rd
- 621 Leyland Ct Unit 14
- 633 Leyland Ct
- 613 Leyland Ct
- 635 Leyland Ct Unit 12
- 607 Leyland Ct
- 626 Leyland Ct
- 638 Leyland Ct Unit 21
- 614 Leyland Ct
- 650 Leyland Ct
- 639 Leyland Ct Unit 11
- 603 Leyland Ct
- 613 Kentwood Ct Unit 25
- 647 Kentwood Ct Unit 23
- 601 Kentwood Ct
- 625 Kentwood Ct Unit 24
- 602 Leyland Ct
- 662 Leyland Ct
- 653 Leyland Ct
- 661 Leyland Ct
- 589 Kentwood Ct Unit 27