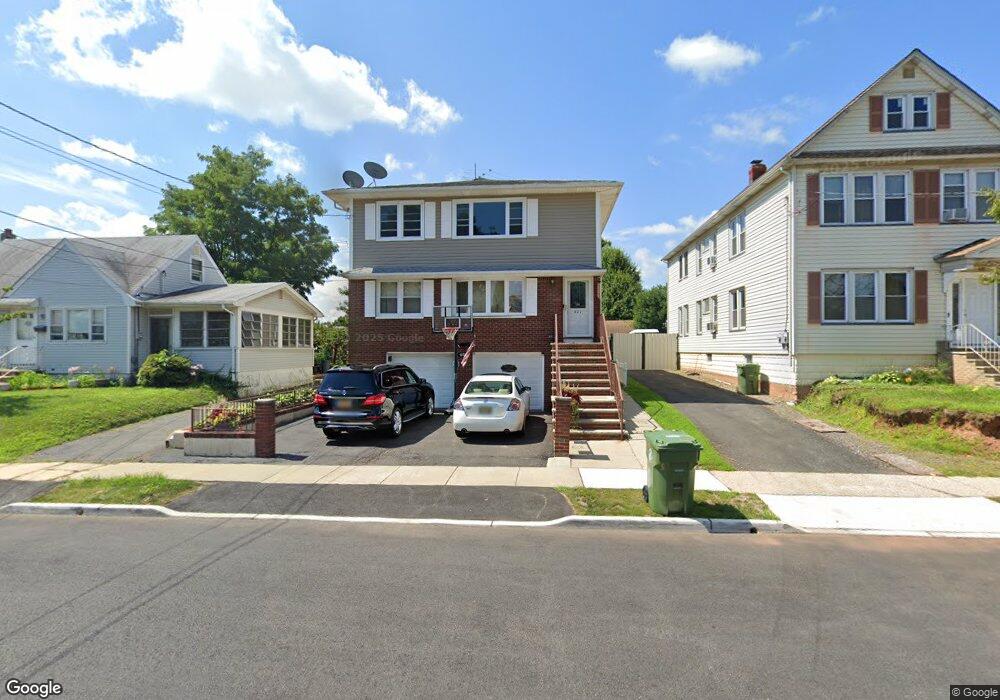
621 Maple Ave Linden, NJ 07036
Estimated Value: $618,721 - $740,000
Studio
--
Bath
1,218
Sq Ft
$552/Sq Ft
Est. Value
About This Home
This home is located at 621 Maple Ave, Linden, NJ 07036 and is currently estimated at $672,680, approximately $552 per square foot. 621 Maple Ave is a home located in Union County with nearby schools including Number 1, Joseph E. Soehl Middle School, and Linden High School.
Ownership History
Date
Name
Owned For
Owner Type
Purchase Details
Closed on
Apr 19, 2002
Sold by
Rocha Anibal M and Rocha Anibal S
Bought by
Rocha Anibal M and Rocha Fabiola C
Current Estimated Value
Home Financials for this Owner
Home Financials are based on the most recent Mortgage that was taken out on this home.
Original Mortgage
$190,200
Outstanding Balance
$80,645
Interest Rate
7.13%
Mortgage Type
Stand Alone First
Estimated Equity
$592,035
Purchase Details
Closed on
May 30, 1997
Sold by
Lopez Manuel and Lopez Christine A
Bought by
Rocha Anibal M and Rocha Anibal S
Home Financials for this Owner
Home Financials are based on the most recent Mortgage that was taken out on this home.
Original Mortgage
$194,275
Interest Rate
7.98%
Mortgage Type
FHA
Create a Home Valuation Report for This Property
The Home Valuation Report is an in-depth analysis detailing your home's value as well as a comparison with similar homes in the area
Home Values in the Area
Average Home Value in this Area
Purchase History
| Date | Buyer | Sale Price | Title Company |
|---|---|---|---|
| Rocha Anibal M | -- | -- | |
| Rocha Anibal M | $200,000 | Lawyers Title Insurance Corp |
Source: Public Records
Mortgage History
| Date | Status | Borrower | Loan Amount |
|---|---|---|---|
| Open | Rocha Anibal M | $190,200 | |
| Closed | Rocha Anibal M | $194,275 |
Source: Public Records
Tax History
| Year | Tax Paid | Tax Assessment Tax Assessment Total Assessment is a certain percentage of the fair market value that is determined by local assessors to be the total taxable value of land and additions on the property. | Land | Improvement |
|---|---|---|---|---|
| 2025 | $13,087 | $186,100 | $46,000 | $140,100 |
| 2024 | $12,800 | $186,100 | $46,000 | $140,100 |
| 2023 | $12,800 | $186,100 | $46,000 | $140,100 |
| 2022 | $12,867 | $186,100 | $46,000 | $140,100 |
| 2021 | $12,932 | $186,100 | $46,000 | $140,100 |
| 2020 | $12,863 | $186,100 | $46,000 | $140,100 |
| 2019 | $12,820 | $186,100 | $46,000 | $140,100 |
| 2018 | $12,817 | $186,100 | $46,000 | $140,100 |
| 2017 | $12,539 | $186,100 | $46,000 | $140,100 |
| 2016 | $12,145 | $186,100 | $46,000 | $140,100 |
| 2015 | $11,682 | $186,100 | $46,000 | $140,100 |
| 2014 | $11,454 | $186,100 | $46,000 | $140,100 |
Source: Public Records
Map
Nearby Homes
- 812 Washington Ave
- 113 E Curtis St
- 534 Monmouth Ave
- 609 Harrison Place
- 914 Bower St
- 918 Bower St
- 100 Luttgen Place
- 721 E Curtis St
- 201 Hussa St
- 909 Seymour Ave
- 506 Bower St
- 725 N Wood Ave
- 18 Hussa St
- 208 E Price St
- 111 Todd Place
- 830 E Curtis St
- 15 E Price St
- 811 Jackson Ave
- 825 Jackson Ave
- 229 Hillcrest Terrace
Your Personal Tour Guide
Ask me questions while you tour the home.