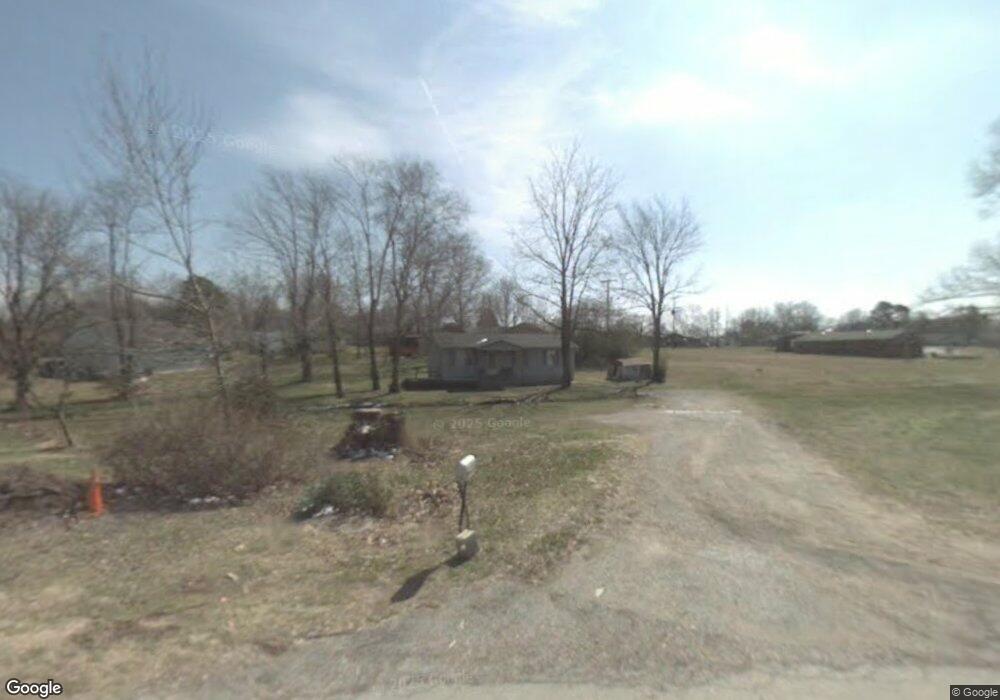
621 Maple St Manchester, TN 37355
Estimated Value: $103,814 - $212,000
Studio
1
Bath
960
Sq Ft
$176/Sq Ft
Est. Value
About This Home
This home is located at 621 Maple St, Manchester, TN 37355 and is currently estimated at $168,704, approximately $175 per square foot. 621 Maple St is a home located in Coffee County with nearby schools including Westwood Middle School and Temple Baptist Christian School.
Ownership History
Date
Name
Owned For
Owner Type
Purchase Details
Closed on
May 24, 2022
Sold by
Eddy Bobby L
Bought by
Botello Edna Nellie
Current Estimated Value
Purchase Details
Closed on
Nov 25, 2008
Sold by
Eddy Carolyn Faye O
Bought by
Eddy Bobby L
Purchase Details
Closed on
Nov 19, 2008
Sold by
Eddy Carolyn Faye O
Bought by
Eddy Bobby L
Purchase Details
Closed on
Jan 3, 1992
Bought by
Eddy Carolyn
Purchase Details
Closed on
Jan 17, 1991
Bought by
Housing & Urban Dev Sec Of Suite 200
Purchase Details
Closed on
Nov 12, 1990
Bought by
First Fed S & L Of Rochester
Purchase Details
Closed on
Jan 2, 1984
Bought by
Prout John T
Create a Home Valuation Report for This Property
The Home Valuation Report is an in-depth analysis detailing your home's value as well as a comparison with similar homes in the area
Home Values in the Area
Average Home Value in this Area
Purchase History
| Date | Buyer | Sale Price | Title Company |
|---|---|---|---|
| Botello Edna Nellie | -- | Shawn C Trail Pc | |
| Eddy Bobby L | -- | -- | |
| Eddy Bobby L | -- | -- | |
| Eddy Carolyn | $14,500 | -- | |
| Housing & Urban Dev Sec Of Suite 200 | $20,000 | -- | |
| First Fed S & L Of Rochester | $20,000 | -- | |
| Prout John T | $23,500 | -- |
Source: Public Records
Tax History
| Year | Tax Paid | Tax Assessment Tax Assessment Total Assessment is a certain percentage of the fair market value that is determined by local assessors to be the total taxable value of land and additions on the property. | Land | Improvement |
|---|---|---|---|---|
| 2025 | $576 | $13,675 | $2,250 | $11,425 |
| 2024 | $576 | $13,675 | $2,250 | $11,425 |
| 2023 | $576 | $13,675 | $0 | $0 |
| 2022 | $503 | $13,850 | $2,400 | $11,450 |
| 2021 | $472 | $10,325 | $2,000 | $8,325 |
| 2020 | $472 | $10,325 | $2,000 | $8,325 |
| 2019 | $472 | $10,325 | $2,000 | $8,325 |
| 2018 | $472 | $10,325 | $2,000 | $8,325 |
| 2017 | $495 | $9,450 | $2,000 | $7,450 |
| 2016 | $495 | $9,450 | $2,000 | $7,450 |
| 2015 | $496 | $9,450 | $2,000 | $7,450 |
| 2014 | $496 | $9,449 | $0 | $0 |
Source: Public Records
Map
Nearby Homes
- 612 Maple St
- 0 W Coffee St
- 317 W Short St
- 728 S Spring St
- 321 W Short St
- 113 W Coffee St
- 715 Madison St
- 412 E Harp St
- 311 Madison St
- 1006 Remington Place
- 611 Park Ave
- 1005 Keylon St
- 802 Lowry St
- 1113 Bond St
- 902 Sycamore Dr
- 1205 Woodcrest Dr
- 1522 S Spring St
- 1212 Woodcrest Dr
- 1015 Hills Chapel Rd
- 1221 Hillcrest Dr
Your Personal Tour Guide
Ask me questions while you tour the home.