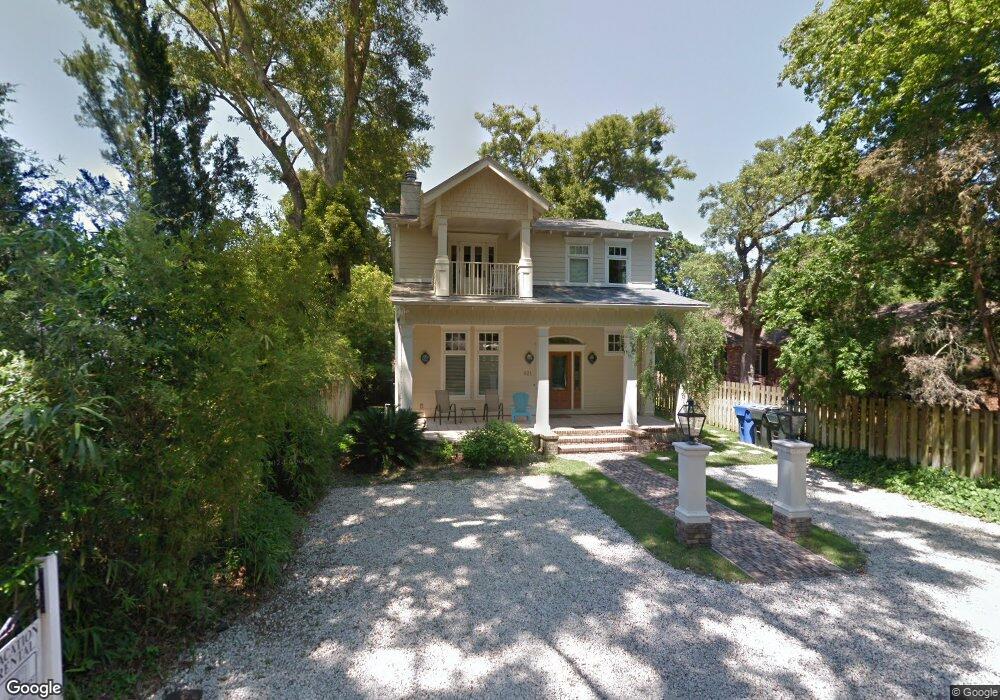
621 May Joe St Saint Simons Island, GA 31522
Estimated Value: $1,564,000 - $2,200,000
4
Beds
6
Baths
3,656
Sq Ft
$531/Sq Ft
Est. Value
About This Home
This home is located at 621 May Joe St, Saint Simons Island, GA 31522 and is currently estimated at $1,939,776, approximately $530 per square foot. 621 May Joe St is a home located in Glynn County with nearby schools including St. Simons Elementary School, Glynn Middle School, and Glynn Academy.
Ownership History
Date
Name
Owned For
Owner Type
Purchase Details
Closed on
May 7, 2008
Sold by
Daniel Roland L
Bought by
Woodruff K Brent and Woodruff Lynn C
Current Estimated Value
Home Financials for this Owner
Home Financials are based on the most recent Mortgage that was taken out on this home.
Original Mortgage
$343,000
Outstanding Balance
$158,315
Interest Rate
5.84%
Mortgage Type
New Conventional
Estimated Equity
$1,781,461
Create a Home Valuation Report for This Property
The Home Valuation Report is an in-depth analysis detailing your home's value as well as a comparison with similar homes in the area
Home Values in the Area
Average Home Value in this Area
Purchase History
| Date | Buyer | Sale Price | Title Company |
|---|---|---|---|
| Woodruff K Brent | $950,000 | -- |
Source: Public Records
Mortgage History
| Date | Status | Borrower | Loan Amount |
|---|---|---|---|
| Open | Woodruff K Brent | $343,000 | |
| Closed | Woodruff K Brent | $417,000 |
Source: Public Records
Tax History Compared to Growth
Tax History
| Year | Tax Paid | Tax Assessment Tax Assessment Total Assessment is a certain percentage of the fair market value that is determined by local assessors to be the total taxable value of land and additions on the property. | Land | Improvement |
|---|---|---|---|---|
| 2025 | $17,416 | $694,440 | $122,240 | $572,200 |
| 2024 | $15,204 | $606,240 | $87,320 | $518,920 |
| 2023 | $15,023 | $606,240 | $87,320 | $518,920 |
| 2022 | $14,912 | $589,600 | $87,320 | $502,280 |
| 2021 | $7,966 | $303,200 | $87,320 | $215,880 |
| 2020 | $8,042 | $303,200 | $87,320 | $215,880 |
| 2019 | $7,585 | $285,720 | $69,840 | $215,880 |
| 2018 | $7,175 | $270,000 | $54,120 | $215,880 |
| 2017 | $7,175 | $270,000 | $54,120 | $215,880 |
| 2016 | $6,605 | $270,000 | $54,120 | $215,880 |
| 2015 | $6,632 | $270,000 | $54,120 | $215,880 |
| 2014 | $6,632 | $270,000 | $54,120 | $215,880 |
Source: Public Records
Map
Nearby Homes
- 652 Oglethorpe Ave
- 625 May Joe St
- 744 Ocean Blvd Unit 202
- 622 Beachview Dr
- 553 Magnolia Ave
- 548 Oglethorpe Ave Unit 11
- 540 Oglethorpe Ave
- 638 Dellwood Ave
- 800 Ocean Blvd Unit 204
- 800 Ocean Blvd Unit 108
- 115 Seaside Cir
- 105 Seaside Cir
- 1017 Ocean View Ave
- 322 5th St
- 908 Ocean Blvd
- 424 Magnolia Ave Unit 6
- 907 Beachview Dr
- 425 Magnolia Ave Unit C
- 416 Magnolia Ave
- 1106 George Lotson Ave
- 617 May Joe St
- 107 Fish Fever Ln Unit 107
- 633 Magnolia Ave
- 616 May Joe St
- 629 May Joe St
- 615 May Joe St
- 624 Demere Way
- 620 Demere Way
- 628 Demere Way
- 628 May Joe St
- 111 Fish Fever Ln
- 111 & 113 Fish Fever Ln
- 613 May Joe St
- 108 Fish Fever Ln
- 632 Demere Way
- 411 Oleander St Unit A
- 411 Oleander St
- 420 12th St
- 112 Fish Fever Ln