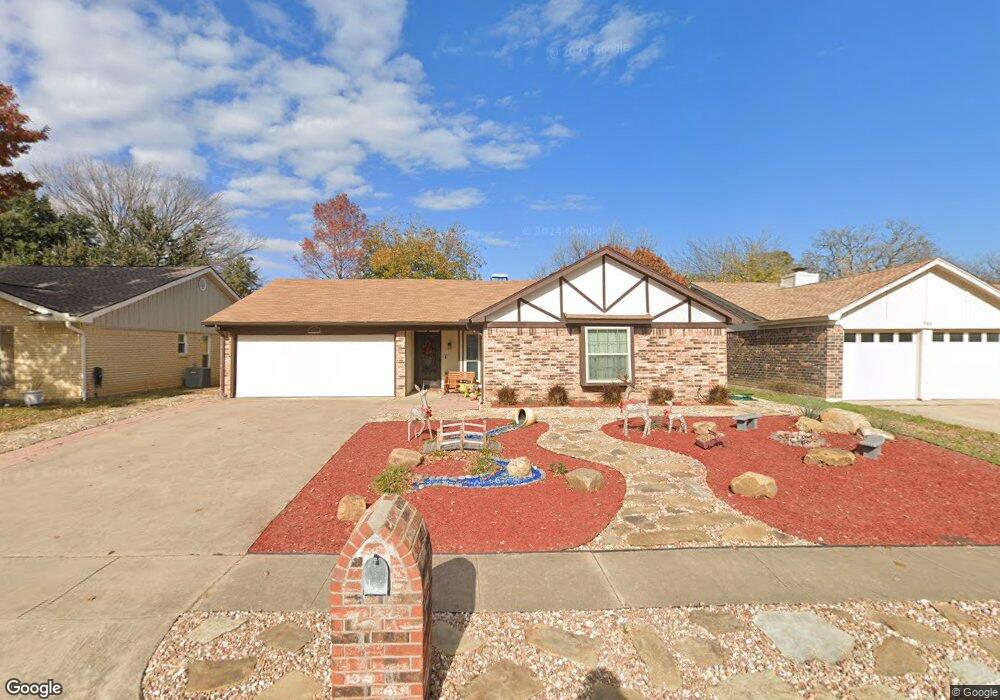
621 Morning Glory Ln Bedford, TX 76021
Estimated Value: $341,000 - $401,987
3
Beds
2
Baths
1,555
Sq Ft
$243/Sq Ft
Est. Value
About This Home
This home is located at 621 Morning Glory Ln, Bedford, TX 76021 and is currently estimated at $378,497, approximately $243 per square foot. 621 Morning Glory Ln is a home located in Tarrant County with nearby schools including Bedford Heights Elementary School, Bedford Junior High School, and L.D. Bell High School.
Ownership History
Date
Name
Owned For
Owner Type
Purchase Details
Closed on
Feb 2, 2017
Sold by
Trumbo Janette M and Carr Carrie L
Bought by
Carr Janette M and Carr Carrie L
Current Estimated Value
Home Financials for this Owner
Home Financials are based on the most recent Mortgage that was taken out on this home.
Original Mortgage
$138,750
Outstanding Balance
$70,415
Interest Rate
4.32%
Mortgage Type
Stand Alone First
Estimated Equity
$308,082
Purchase Details
Closed on
Feb 18, 2003
Sold by
Prothman Hubbard Cynthia Jean and Hubbard Gregory G
Bought by
Trumbo Janette M
Home Financials for this Owner
Home Financials are based on the most recent Mortgage that was taken out on this home.
Original Mortgage
$133,723
Interest Rate
5.86%
Mortgage Type
FHA
Create a Home Valuation Report for This Property
The Home Valuation Report is an in-depth analysis detailing your home's value as well as a comparison with similar homes in the area
Home Values in the Area
Average Home Value in this Area
Purchase History
| Date | Buyer | Sale Price | Title Company |
|---|---|---|---|
| Carr Janette M | -- | None Available | |
| Trumbo Janette M | -- | Alamo Title Company |
Source: Public Records
Mortgage History
| Date | Status | Borrower | Loan Amount |
|---|---|---|---|
| Open | Carr Janette M | $138,750 | |
| Closed | Trumbo Janette M | $133,723 |
Source: Public Records
Tax History Compared to Growth
Tax History
| Year | Tax Paid | Tax Assessment Tax Assessment Total Assessment is a certain percentage of the fair market value that is determined by local assessors to be the total taxable value of land and additions on the property. | Land | Improvement |
|---|---|---|---|---|
| 2025 | $3,819 | $399,977 | $75,000 | $324,977 |
| 2024 | $3,819 | $399,977 | $75,000 | $324,977 |
| 2023 | $6,426 | $364,000 | $55,000 | $309,000 |
| 2022 | $6,653 | $325,567 | $55,000 | $270,567 |
| 2021 | $6,523 | $286,346 | $55,000 | $231,346 |
| 2020 | $5,985 | $267,715 | $55,000 | $212,715 |
| 2019 | $5,559 | $251,215 | $55,000 | $196,215 |
| 2018 | $4,672 | $208,035 | $55,000 | $153,035 |
| 2017 | $4,575 | $222,165 | $30,000 | $192,165 |
| 2016 | $4,159 | $177,454 | $30,000 | $147,454 |
| 2015 | $3,650 | $156,300 | $20,000 | $136,300 |
| 2014 | $3,650 | $156,300 | $20,000 | $136,300 |
Source: Public Records
Map
Nearby Homes
- 628 Huntwich Dr
- 3605 Spring Valley Dr
- 909 Brestol Ct W
- 405 Woodbriar Ct
- 3609 Wayne Ct
- 3624 Wayne Ct
- 305 Warbler Dr
- 3213 Spring Valley Dr
- 1109 Simpson Terrace
- 913 Kensington Ct
- 320 Blue Quail Ct
- 3119 Spring Grove Dr
- 4105 Inwood Ln
- 1136 Wingate Dr
- 4002 Copperwood Ct
- 3907 Copperwood Ct
- 3301 Wendover Ct
- 3713 Brentwood Ct
- 801 Shady Creek Ln
- 1209 Hillandale Ct
- 701 Morning Glory Ln
- 617 Morning Glory Ln
- 620 Mountain Laurel Ln
- 705 Morning Glory Ln
- 613 Morning Glory Ln
- 700 Mountain Laurel Ln
- 616 Mountain Laurel Ln
- 704 Mountain Laurel Ln
- 612 Mountain Laurel Ln
- 616 Morning Glory Ln
- 612 Morning Glory Ln
- 709 Morning Glory Ln
- 609 Morning Glory Ln
- 700 Morning Glory Ln
- 708 Mountain Laurel Ln
- 608 Morning Glory Ln
- 608 Mountain Laurel Ln
- 713 Morning Glory Ln
- 605 Morning Glory Ln
- 712 Mountain Laurel Ln