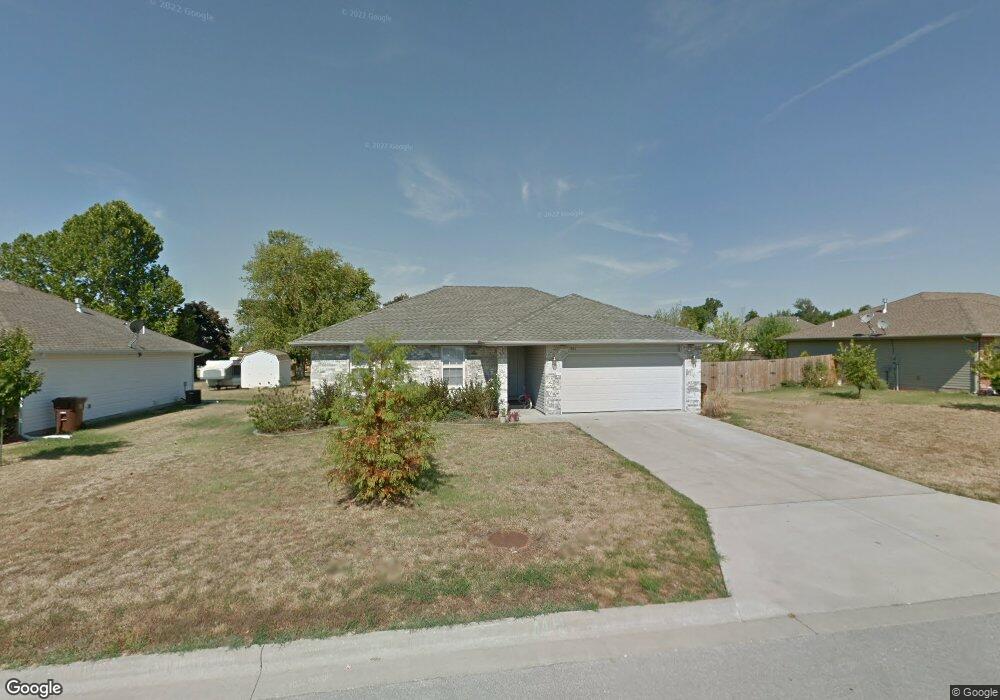
621 N Franklin Ave Republic, MO 65738
Estimated Value: $238,191 - $262,000
3
Beds
2
Baths
1,322
Sq Ft
$187/Sq Ft
Est. Value
About This Home
This home is located at 621 N Franklin Ave, Republic, MO 65738 and is currently estimated at $247,298, approximately $187 per square foot. 621 N Franklin Ave is a home located in Greene County with nearby schools including Price Elementary School, Republic Middle School, and Republic High School.
Ownership History
Date
Name
Owned For
Owner Type
Purchase Details
Closed on
Mar 4, 2014
Sold by
Morelock Family Lp
Bought by
Tri Property Group Llc
Current Estimated Value
Home Financials for this Owner
Home Financials are based on the most recent Mortgage that was taken out on this home.
Original Mortgage
$86,598
Outstanding Balance
$65,887
Interest Rate
4.44%
Mortgage Type
Future Advance Clause Open End Mortgage
Estimated Equity
$181,411
Purchase Details
Closed on
Oct 5, 2011
Sold by
Morlock Ross Properties Inc
Bought by
Morelock Family Lp
Home Financials for this Owner
Home Financials are based on the most recent Mortgage that was taken out on this home.
Original Mortgage
$83,250
Interest Rate
4.28%
Mortgage Type
Future Advance Clause Open End Mortgage
Purchase Details
Closed on
Feb 23, 2007
Sold by
Morelock Ross Properties Inc
Bought by
Souter Chris S
Home Financials for this Owner
Home Financials are based on the most recent Mortgage that was taken out on this home.
Original Mortgage
$121,900
Interest Rate
6.17%
Mortgage Type
Purchase Money Mortgage
Create a Home Valuation Report for This Property
The Home Valuation Report is an in-depth analysis detailing your home's value as well as a comparison with similar homes in the area
Home Values in the Area
Average Home Value in this Area
Purchase History
| Date | Buyer | Sale Price | Title Company |
|---|---|---|---|
| Tri Property Group Llc | -- | None Available | |
| Morelock Family Lp | -- | None Available | |
| Souter Chris S | -- | None Available |
Source: Public Records
Mortgage History
| Date | Status | Borrower | Loan Amount |
|---|---|---|---|
| Open | Tri Property Group Llc | $86,598 | |
| Previous Owner | Morelock Family Lp | $83,250 | |
| Previous Owner | Souter Chris S | $121,900 |
Source: Public Records
Tax History Compared to Growth
Tax History
| Year | Tax Paid | Tax Assessment Tax Assessment Total Assessment is a certain percentage of the fair market value that is determined by local assessors to be the total taxable value of land and additions on the property. | Land | Improvement |
|---|---|---|---|---|
| 2025 | $1,580 | $31,410 | $5,700 | $25,710 |
| 2024 | $1,580 | $28,290 | $4,750 | $23,540 |
| 2023 | $1,550 | $28,290 | $4,750 | $23,540 |
| 2022 | $1,374 | $24,950 | $4,750 | $20,200 |
| 2021 | $1,365 | $24,950 | $4,750 | $20,200 |
| 2020 | $1,286 | $23,140 | $4,750 | $18,390 |
| 2019 | $1,282 | $23,140 | $4,750 | $18,390 |
| 2018 | $1,179 | $20,560 | $3,800 | $16,760 |
| 2017 | $1,169 | $19,670 | $3,800 | $15,870 |
| 2016 | $1,131 | $19,670 | $3,800 | $15,870 |
| 2015 | $1,127 | $19,670 | $3,800 | $15,870 |
| 2014 | $1,086 | $18,790 | $3,800 | $14,990 |
Source: Public Records
Map
Nearby Homes
- 715 N Franklin Ave
- 733 N Franklin Ave
- 761 N Lexington Ave
- 508 Glenwood Ave
- 747 N Glenwood Ave
- 515 N Glenwood Ave
- 7217 W Farm Road 182
- 0 W Farm Road 174 Unit 60286557
- 435 N Claremont Place
- 4889 S Douglas Dr
- 436 N Murphy Dr
- 2465 E Timber Oak St
- 1226 N London Place
- 1265 N Willow Cir
- Lot 24 The Woods
- 1550KP-4 Plan at Greenfield Estates
- 1350 Plan at Greenfield Estates
- 1400 Plan at Greenfield Estates
- 1505KP-4 Cottage Plan at Greenfield Estates
- 3014 E Heritage St
- 635 N Franklin Ave
- 605 N Franklin Ave
- 3152 E Jamestown St
- 3151 E Jamestown St
- 653 N Franklin Ave
- 3166 E Jamestown St
- 6868 W Farm Rd 178
- 664 N Delaware Ave
- 3191 E Hines St
- 3167 E Jamestown St
- 667 N Franklin Ave
- 3172 E Jamestown St
- 3154 E Colonial St
- 598 N Texas Ave
- 692 N Delaware Ave
- 598 Texas
- 3179 E Jamestown St
- 3168 E Colonial St
- 3184 E Jamestown St
- 3174 E Colonial St