Estimated Value: $527,000 - $633,000
3
Beds
1
Bath
1,721
Sq Ft
$339/Sq Ft
Est. Value
About This Home
This home is located at 621 N Methow Valley Hwy, Twisp, WA 98856 and is currently estimated at $583,488, approximately $339 per square foot. 621 N Methow Valley Hwy is a home located in Okanogan County with nearby schools including Methow Valley Elementary School, Liberty Bell Junior/Senior High School, and Methow Valley Independent Learning Center.
Ownership History
Date
Name
Owned For
Owner Type
Purchase Details
Closed on
Jul 25, 2019
Sold by
Thomson Walter W and Thomson Geraldine E
Bought by
Lundquist Wyatt and Thomson Rebecca
Current Estimated Value
Home Financials for this Owner
Home Financials are based on the most recent Mortgage that was taken out on this home.
Original Mortgage
$295,850
Outstanding Balance
$259,084
Interest Rate
3.8%
Mortgage Type
New Conventional
Estimated Equity
$324,404
Purchase Details
Closed on
Sep 9, 2016
Sold by
Cramer John E and Cramer Carrie L
Bought by
Thomson Walter W and Thomson Geraldine E
Home Financials for this Owner
Home Financials are based on the most recent Mortgage that was taken out on this home.
Original Mortgage
$209,407
Interest Rate
3.43%
Mortgage Type
VA
Create a Home Valuation Report for This Property
The Home Valuation Report is an in-depth analysis detailing your home's value as well as a comparison with similar homes in the area
Home Values in the Area
Average Home Value in this Area
Purchase History
| Date | Buyer | Sale Price | Title Company |
|---|---|---|---|
| Lundquist Wyatt | $305,000 | Wfg National Title Company | |
| Thomson Walter W | $205,000 | Inland Professional Title |
Source: Public Records
Mortgage History
| Date | Status | Borrower | Loan Amount |
|---|---|---|---|
| Open | Lundquist Wyatt | $295,850 | |
| Previous Owner | Thomson Walter W | $209,407 |
Source: Public Records
Tax History Compared to Growth
Tax History
| Year | Tax Paid | Tax Assessment Tax Assessment Total Assessment is a certain percentage of the fair market value that is determined by local assessors to be the total taxable value of land and additions on the property. | Land | Improvement |
|---|---|---|---|---|
| 2025 | $3,561 | $487,500 | $108,700 | $378,800 |
| 2024 | $3,561 | $487,500 | $108,700 | $378,800 |
| 2023 | $3,246 | $400,100 | $108,700 | $291,400 |
| 2022 | $3,459 | $331,800 | $105,200 | $226,600 |
| 2021 | $3,671 | $331,800 | $105,200 | $226,600 |
| 2020 | $3,112 | $331,800 | $105,200 | $226,600 |
| 2019 | $2,968 | $279,500 | $105,200 | $174,300 |
| 2018 | $3,143 | $279,500 | $105,200 | $174,300 |
| 2017 | $2,885 | $279,500 | $105,200 | $174,300 |
| 2016 | $2,760 | $279,200 | $105,200 | $174,000 |
| 2015 | $2,543 | $279,200 | $105,200 | $174,000 |
| 2013 | -- | $279,200 | $105,200 | $174,000 |
Source: Public Records
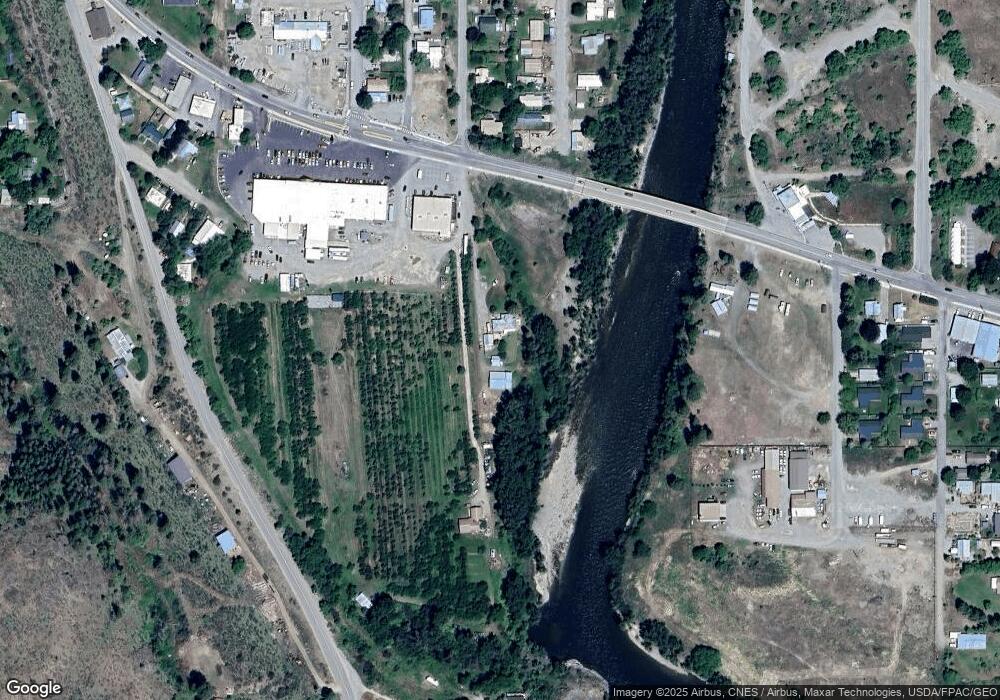
Map
Nearby Homes
- 803 D Twisp Carlton Rd
- 318 Lombard St
- 0 Lot 2 Amended Surface Short Plat
- 1110 Riverside Ave
- 1221 Riverside Ave
- 303 E 2nd Ave
- 136 Johnson St
- 115 Johnson St N Unit 1,2,3
- 140 Twisp Ave W Unit 204
- 0 Isabella Ln Unit NWM2400755
- 0 Isabella Ln Unit NWM2400767
- 799 Twisp River Rd
- 96 Alder Creek Rd
- 803 C Twisp Carlton
- 2992 Washington 153
- 48 Thurlow Rd
- 121 Finley Canyon Rd
- 143 Harrier Hill Rd
- 54B Ross Rd Unit B
- 245 Twisp Carlton Rd
- 0 Schulz Ln Unit 1750993
- 503 E Methow Valley Hwy
- 626 Alder St
- 420 N Methow Valley Hwy
- 601 Webb Ln
- 627 Bridge St
- 411 E Methow Valley Hwy
- 502 E Methow Valley Hwy St
- 603 Webb Ln
- 619 E Methow Valley Hwy
- 574 E County Rd
- 657 E Co Rd
- 423 E County Rd
- 423 E County Rd Unit Lot 3
- 423 E County Rd Unit Lot 2
- 614 Bridge St
- 614 Alder St
- 625 Bridge St
- 204 Industrial Park Ave
- 900 N Methow Valley Hwy