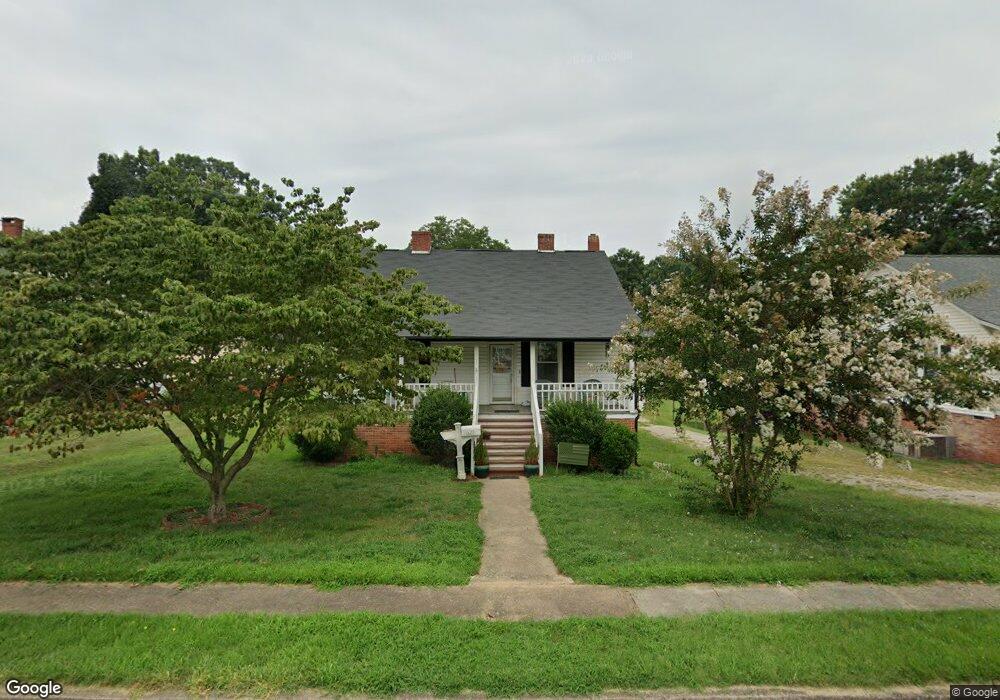
621 N Walnut St Kannapolis, NC 28081
Estimated Value: $251,294 - $279,000
--
Bed
1
Bath
2,208
Sq Ft
$119/Sq Ft
Est. Value
About This Home
This home is located at 621 N Walnut St, Kannapolis, NC 28081 and is currently estimated at $262,824, approximately $119 per square foot. 621 N Walnut St is a home located in Rowan County with nearby schools including North Kannapolis Elementary School, Kannapolis Middle, and A.L. Brown High School.
Ownership History
Date
Name
Owned For
Owner Type
Purchase Details
Closed on
Oct 27, 2017
Sold by
Mcguire Richard and Mcguire Teresa A
Bought by
Albright Daryl Victor
Current Estimated Value
Purchase Details
Closed on
May 20, 2015
Sold by
Gulledge Benjamin D and Gulledge Jennifer C
Bought by
Mcguire Richard and Albright Daryl Victor
Purchase Details
Closed on
Jan 18, 2005
Sold by
Wachovia Bank Of Delaware Na
Bought by
Gulledge Benjamin Denell
Home Financials for this Owner
Home Financials are based on the most recent Mortgage that was taken out on this home.
Original Mortgage
$51,200
Interest Rate
6.99%
Mortgage Type
Unknown
Purchase Details
Closed on
May 3, 2004
Sold by
Safrit Christopher and Safrit Brandi M
Bought by
Wachovia Bank Of Delaware Na
Create a Home Valuation Report for This Property
The Home Valuation Report is an in-depth analysis detailing your home's value as well as a comparison with similar homes in the area
Home Values in the Area
Average Home Value in this Area
Purchase History
| Date | Buyer | Sale Price | Title Company |
|---|---|---|---|
| Albright Daryl Victor | -- | None Available | |
| Mcguire Richard | $38,220 | None Available | |
| Gulledge Benjamin Denell | $64,000 | -- | |
| Wachovia Bank Of Delaware Na | $78,236 | -- |
Source: Public Records
Mortgage History
| Date | Status | Borrower | Loan Amount |
|---|---|---|---|
| Previous Owner | Gulledge Benjamin Denell | $51,200 |
Source: Public Records
Tax History Compared to Growth
Tax History
| Year | Tax Paid | Tax Assessment Tax Assessment Total Assessment is a certain percentage of the fair market value that is determined by local assessors to be the total taxable value of land and additions on the property. | Land | Improvement |
|---|---|---|---|---|
| 2025 | $2,505 | $207,042 | $28,500 | $178,542 |
| 2024 | $2,505 | $207,042 | $28,500 | $178,542 |
| 2023 | $2,505 | $207,042 | $28,500 | $178,542 |
| 2022 | $1,405 | $109,124 | $22,000 | $87,124 |
| 2021 | $1,405 | $109,124 | $22,000 | $87,124 |
| 2020 | $1,405 | $109,124 | $22,000 | $87,124 |
| 2019 | $1,405 | $109,124 | $22,000 | $87,124 |
| 2018 | $1,269 | $99,666 | $24,024 | $75,642 |
| 2017 | $1,269 | $99,666 | $24,024 | $75,642 |
| 2016 | $1,269 | $99,666 | $24,024 | $75,642 |
| 2015 | $1,288 | $99,666 | $24,024 | $75,642 |
| 2014 | $1,225 | $97,983 | $20,020 | $77,963 |
Source: Public Records
Map
Nearby Homes
- 510 W 9th St
- 504 Locust St
- 203 Allen St
- 519 N Rose Ave
- 450 Contentment Ct
- 1560 Solitude Ct Unit 11
- 409 Oak Cir
- 1540 Solitude Ct
- 445 Contentment Ct Unit 19
- 465 Contentment Ct
- 303 E 4th St
- 212 Kimball St
- 911 Elm St
- 502 Helen St
- 0 Goble Ave
- 1001 N Cannon Blvd
- 601 E 13th St
- 1204 W A St
- 100 N Ridge Ave
- 1302 W A St
- 623 N Walnut St
- 619 N Walnut St
- 617 N Walnut St
- 622 Poplar Ave
- 624 Poplar Ave
- 620 Poplar Ave
- 622 N Walnut St
- 801 N Walnut St
- 624 N Walnut St
- 620 N Walnut St
- 618 Poplar Ave
- 615 N Walnut St
- 618 N Walnut St
- 616 Poplar Ave
- 613 N Walnut St
- 616 N Walnut St
- 623 Poplar Ave
- 802 Poplar Ave
- 801 Poplar Ave
- 614 Poplar Ave