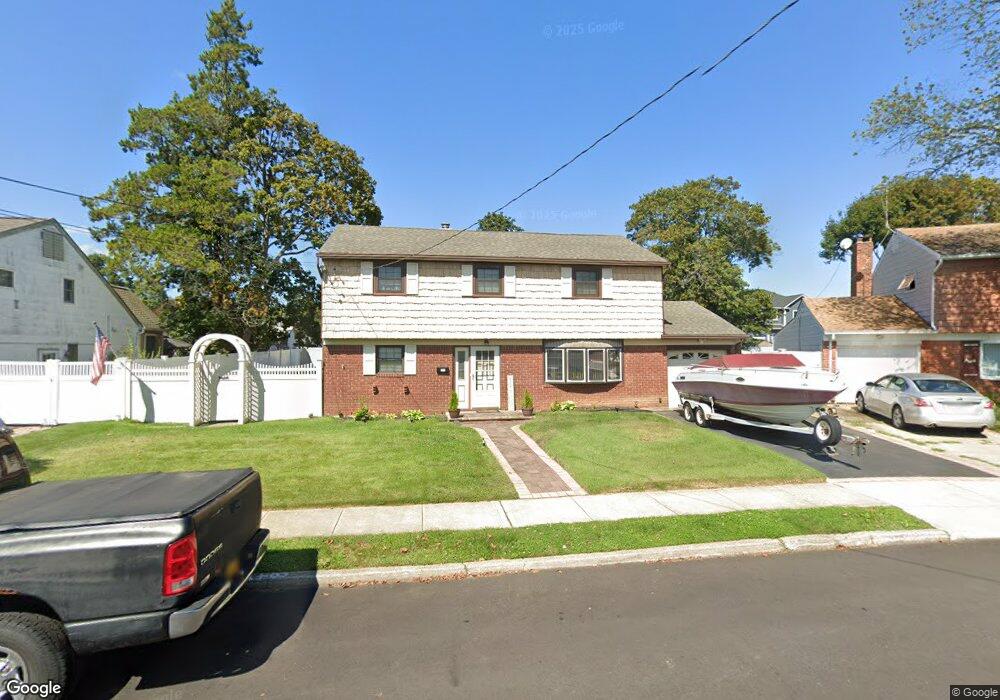
621 Nimrod Ct North Babylon, NY 11703
Estimated Value: $440,000 - $675,000
--
Bed
1
Bath
1,829
Sq Ft
$322/Sq Ft
Est. Value
About This Home
This home is located at 621 Nimrod Ct, North Babylon, NY 11703 and is currently estimated at $589,782, approximately $322 per square foot. 621 Nimrod Ct is a home located in Suffolk County with nearby schools including Robert Moses Middle School and North Babylon High School.
Ownership History
Date
Name
Owned For
Owner Type
Purchase Details
Closed on
Jan 25, 2024
Sold by
Brady Ronald Est and Brady
Bought by
Pearson Tyquan and Wallace Tonya
Current Estimated Value
Home Financials for this Owner
Home Financials are based on the most recent Mortgage that was taken out on this home.
Original Mortgage
$432,030
Interest Rate
7.25%
Mortgage Type
FHA
Purchase Details
Closed on
Nov 19, 1999
Sold by
Cathcart Joan
Bought by
Brady Ronald Walter and Brady Denise Ann
Home Financials for this Owner
Home Financials are based on the most recent Mortgage that was taken out on this home.
Original Mortgage
$151,200
Interest Rate
7.86%
Mortgage Type
Purchase Money Mortgage
Create a Home Valuation Report for This Property
The Home Valuation Report is an in-depth analysis detailing your home's value as well as a comparison with similar homes in the area
Home Values in the Area
Average Home Value in this Area
Purchase History
| Date | Buyer | Sale Price | Title Company |
|---|---|---|---|
| Pearson Tyquan | $440,000 | None Available | |
| Pearson Tyquan | $440,000 | None Available | |
| Brady Ronald Walter | $189,000 | Pioneer Land Title Corp | |
| Brady Ronald Walter | $189,000 | Pioneer Land Title Corp |
Source: Public Records
Mortgage History
| Date | Status | Borrower | Loan Amount |
|---|---|---|---|
| Previous Owner | Pearson Tyquan | $432,030 | |
| Previous Owner | Brady Ronald Walter | $151,200 |
Source: Public Records
Tax History Compared to Growth
Tax History
| Year | Tax Paid | Tax Assessment Tax Assessment Total Assessment is a certain percentage of the fair market value that is determined by local assessors to be the total taxable value of land and additions on the property. | Land | Improvement |
|---|---|---|---|---|
| 2024 | $10,673 | $3,630 | $300 | $3,330 |
| 2023 | $10,673 | $3,630 | $300 | $3,330 |
| 2022 | $8,670 | $3,630 | $300 | $3,330 |
| 2021 | $8,670 | $3,630 | $300 | $3,330 |
| 2020 | $9,371 | $3,630 | $300 | $3,330 |
| 2019 | $9,371 | $0 | $0 | $0 |
| 2018 | $8,846 | $3,630 | $300 | $3,330 |
| 2017 | $8,846 | $3,630 | $300 | $3,330 |
| 2016 | $8,717 | $3,630 | $300 | $3,330 |
| 2015 | -- | $3,630 | $300 | $3,330 |
| 2014 | -- | $3,630 | $300 | $3,330 |
Source: Public Records
Map
Nearby Homes