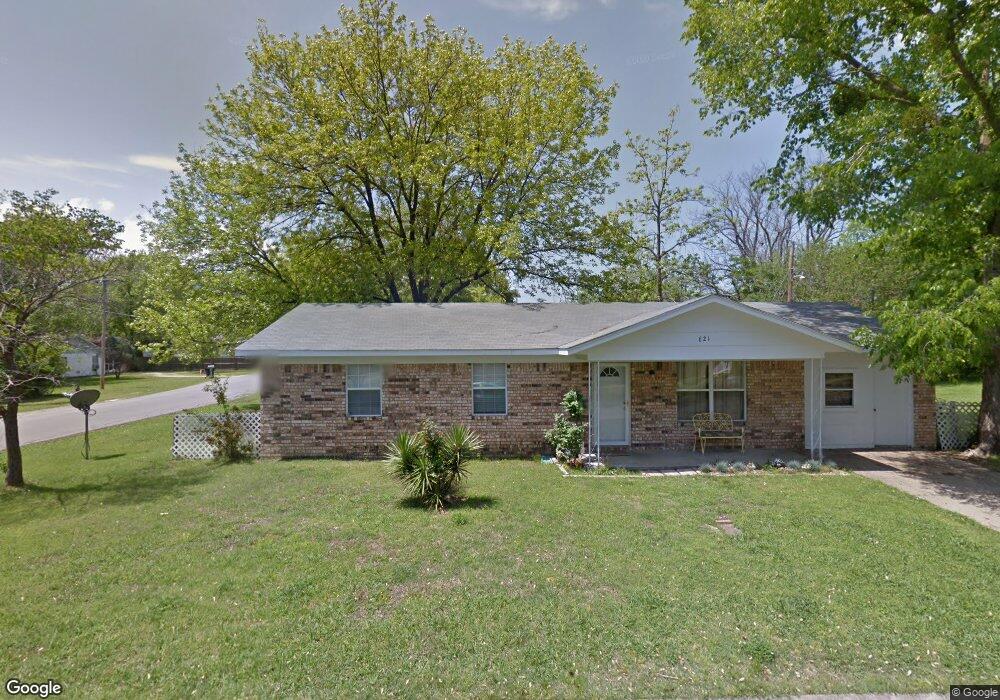
621 S Lucy St Sallisaw, OK 74955
Estimated Value: $135,000 - $153,000
3
Beds
2
Baths
1,352
Sq Ft
$108/Sq Ft
Est. Value
About This Home
This home is located at 621 S Lucy St, Sallisaw, OK 74955 and is currently estimated at $145,871, approximately $107 per square foot. 621 S Lucy St is a home located in Sequoyah County with nearby schools including Liberty Elementary School, Eastside Elementary School, and Sallisaw Middle School.
Ownership History
Date
Name
Owned For
Owner Type
Purchase Details
Closed on
Apr 18, 2025
Sold by
Curry Bailey Nicole and Rouse Bailey
Bought by
Curry Jakeb
Current Estimated Value
Purchase Details
Closed on
Apr 9, 2021
Sold by
Sweeney Sonny J and Sweeney Tina
Bought by
Curry Jakeb Thomas and Curry Bailey Nicole
Home Financials for this Owner
Home Financials are based on the most recent Mortgage that was taken out on this home.
Original Mortgage
$91,967
Interest Rate
2.9%
Mortgage Type
VA
Purchase Details
Closed on
Jun 14, 2010
Sold by
Ernst Ann and Ernst Anne
Bought by
Ernest Bryan
Purchase Details
Closed on
Jan 14, 2008
Sold by
Ernst Brayn
Bought by
Sweeney Sonny J and Sweeney Tina
Purchase Details
Closed on
Jul 22, 2005
Sold by
Smith Pamela Jo
Bought by
Ernst Bryan and Ernst Ann
Home Financials for this Owner
Home Financials are based on the most recent Mortgage that was taken out on this home.
Original Mortgage
$50,000
Interest Rate
10.6%
Mortgage Type
Adjustable Rate Mortgage/ARM
Create a Home Valuation Report for This Property
The Home Valuation Report is an in-depth analysis detailing your home's value as well as a comparison with similar homes in the area
Home Values in the Area
Average Home Value in this Area
Purchase History
| Date | Buyer | Sale Price | Title Company |
|---|---|---|---|
| Curry Jakeb | -- | None Listed On Document | |
| Curry Jakeb Thomas | $89,900 | Valley Land Title Company | |
| Ernest Bryan | -- | None Available | |
| Sweeney Sonny J | -- | None Available | |
| Ernst Bryan | $50,000 | None Available |
Source: Public Records
Mortgage History
| Date | Status | Borrower | Loan Amount |
|---|---|---|---|
| Previous Owner | Curry Jakeb Thomas | $91,967 | |
| Previous Owner | Ernst Bryan | $50,000 |
Source: Public Records
Tax History Compared to Growth
Tax History
| Year | Tax Paid | Tax Assessment Tax Assessment Total Assessment is a certain percentage of the fair market value that is determined by local assessors to be the total taxable value of land and additions on the property. | Land | Improvement |
|---|---|---|---|---|
| 2025 | $1,056 | $11,357 | $1,261 | $10,096 |
| 2024 | $1,056 | $10,816 | $1,320 | $9,496 |
| 2023 | $983 | $10,301 | $1,320 | $8,981 |
| 2022 | $844 | $9,900 | $1,320 | $8,580 |
| 2021 | $573 | $6,732 | $1,320 | $5,412 |
| 2020 | $584 | $6,732 | $1,320 | $5,412 |
| 2019 | $599 | $6,842 | $1,320 | $5,522 |
| 2018 | $627 | $7,095 | $1,452 | $5,643 |
| 2017 | $636 | $7,216 | $1,452 | $5,764 |
| 2016 | $626 | $7,020 | $1,369 | $5,651 |
| 2015 | $607 | $6,685 | $949 | $5,736 |
| 2014 | $578 | $6,367 | $876 | $5,491 |
Source: Public Records
Map
Nearby Homes
- 706 E Delaware St
- 706 E Lucy Ave
- 408 S Cherry St
- 711 E Lucy Ave
- 322 S Locust St
- 930 Mattox Ln
- 703 E Ida Ave
- TBD Chestnut St
- 831 E Mary Ave
- 111 N Holly St
- 504 E Choctaw Ave
- 621 S Elm St
- 200 E Scott Ave
- 830 E Chickasaw Place
- 401 E Choctaw Ave
- 409 E Choctaw Ave
- 1019 E Choctaw Ave
- 205 W Port Arthur Ave
- 0 Rural Route Unit 2535327
- Tbd W Wyandotte Ave
- 601 Magnolia Loop
- 617 S Lucy St
- 620 S Lucy St
- 504 E Lucy Ave
- 616 S Lucy St
- 604 Magnolia Loop
- 620 S Mulberry St
- 610 S Mulberry St
- 613 S Lucy St
- 612 S Lucy St
- 502 E Lucy Ave
- 617 S Holly St
- 613 S Holly St
- 611 Magnolia Loop
- 609 S Holly St
- 500 S Holly St
- 606 S Holly St
- 620 S Holly St
- 610 S Lucy St
- 619 S Mulberry St