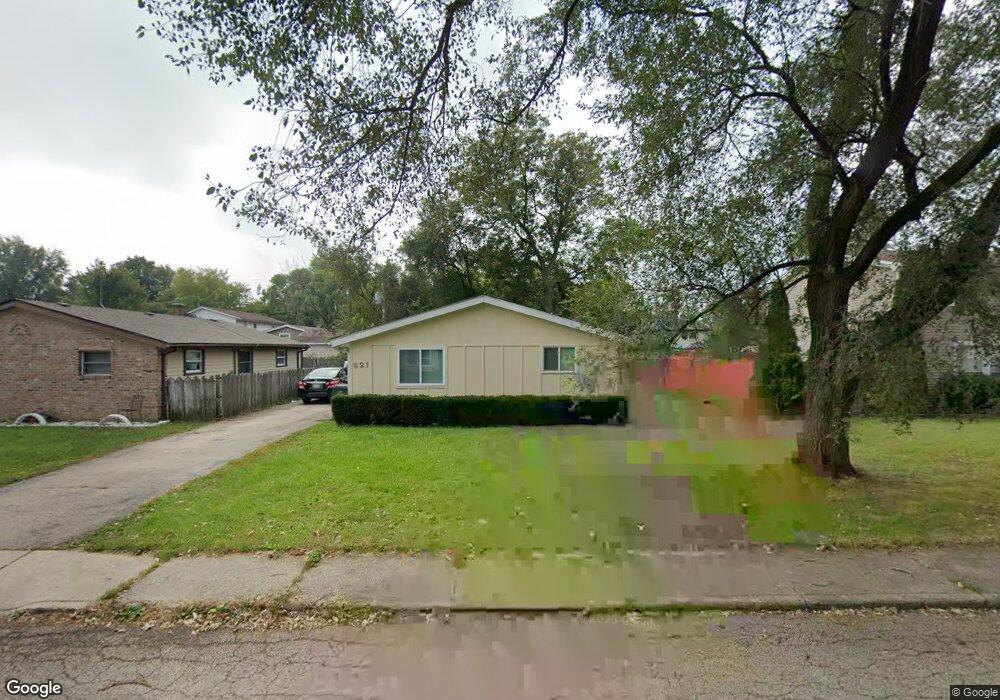
621 Santa fe Ave Carpentersville, IL 60110
Estimated Value: $223,000 - $238,637
3
Beds
--
Bath
1,036
Sq Ft
$223/Sq Ft
Est. Value
About This Home
This home is located at 621 Santa fe Ave, Carpentersville, IL 60110 and is currently estimated at $230,909, approximately $222 per square foot. 621 Santa fe Ave is a home located in Kane County with nearby schools including Sunny Hill Elementary School, Barrington Mdle School- Prairie Cmps, and Barrington High School.
Ownership History
Date
Name
Owned For
Owner Type
Purchase Details
Closed on
Jul 25, 2013
Sold by
Walocha Michael
Bought by
Walocha Michael and Walocha Lori
Current Estimated Value
Home Financials for this Owner
Home Financials are based on the most recent Mortgage that was taken out on this home.
Original Mortgage
$91,050
Outstanding Balance
$66,235
Interest Rate
3.93%
Mortgage Type
New Conventional
Estimated Equity
$164,674
Purchase Details
Closed on
Apr 30, 2003
Sold by
Corcoran Kenneth L
Bought by
Walocha Michael
Home Financials for this Owner
Home Financials are based on the most recent Mortgage that was taken out on this home.
Original Mortgage
$99,200
Interest Rate
6.25%
Mortgage Type
Purchase Money Mortgage
Purchase Details
Closed on
Dec 19, 2002
Sold by
Krinninger Pauline
Bought by
Corcoran Kenneth L
Purchase Details
Closed on
Oct 24, 2002
Sold by
Va
Bought by
Krinninger Pauline and Estate Of Andy L Linnaberry
Create a Home Valuation Report for This Property
The Home Valuation Report is an in-depth analysis detailing your home's value as well as a comparison with similar homes in the area
Home Values in the Area
Average Home Value in this Area
Purchase History
| Date | Buyer | Sale Price | Title Company |
|---|---|---|---|
| Walocha Michael | -- | None Available | |
| Walocha Michael | $124,000 | -- | |
| Corcoran Kenneth L | $90,000 | -- | |
| Krinninger Pauline | -- | -- |
Source: Public Records
Mortgage History
| Date | Status | Borrower | Loan Amount |
|---|---|---|---|
| Open | Walocha Michael | $91,050 | |
| Previous Owner | Walocha Michael | $99,200 |
Source: Public Records
Tax History
| Year | Tax Paid | Tax Assessment Tax Assessment Total Assessment is a certain percentage of the fair market value that is determined by local assessors to be the total taxable value of land and additions on the property. | Land | Improvement |
|---|---|---|---|---|
| 2024 | $4,973 | $64,351 | $12,553 | $51,798 |
| 2023 | $4,786 | $57,901 | $11,295 | $46,606 |
| 2022 | $3,902 | $45,422 | $11,295 | $34,127 |
| 2021 | $3,767 | $42,888 | $10,665 | $32,223 |
| 2020 | $3,598 | $41,924 | $10,425 | $31,499 |
| 2019 | $3,411 | $39,799 | $9,897 | $29,902 |
| 2018 | $3,238 | $36,189 | $9,701 | $26,488 |
| 2017 | $3,028 | $33,853 | $9,075 | $24,778 |
| 2016 | $2,756 | $29,310 | $8,787 | $20,523 |
| 2015 | -- | $23,746 | $8,234 | $15,512 |
| 2014 | -- | $21,475 | $8,007 | $13,468 |
| 2013 | -- | $22,371 | $8,252 | $14,119 |
Source: Public Records
Map
Nearby Homes
- 153 Algonquin Rd
- 19 Helm Rd
- 113 Hickory Dr
- Lot 17C Alameda Dr
- Lot 17 Alameda Dr
- Lot 17B Alameda Dr
- Lot 17D Alameda Dr
- Lot 17A Alameda Dr
- 7 Autumn Trail
- 2134 Aberdeen Dr
- 1811 IL Rte 25 (Elgin) Rd
- 73 Wren Rd
- 59 Wren Rd
- 34 Cardinal Ln
- 1429 Kings Rd
- 28 Hickory Dr
- 1117 Silverstone Dr Unit 1109
- 2113 Elgin Rd
- 1009 Silverstone Dr Unit 1005
- 417 Silverstone Dr Unit 417
- 619 Santa fe Ave
- 623 Santa fe Ave
- 520 Apache Ave
- 617 Santa fe Ave Unit 5
- 625 Santa fe Ave
- 518 Apache Ave
- 522 Apache Ave
- 620 Santa fe Ave
- 622 Santa fe Ave
- 516 Apache Ave
- 524 Apache Ave
- 618 Santa fe Ave
- 615 Santa fe Ave
- 627 Santa fe Ave
- 624 Santa fe Ave
- 514 Apache Ave
- 526 Apache Ave Unit 5
- 616 Santa fe Ave
- 613 Santa fe Ave
Your Personal Tour Guide
Ask me questions while you tour the home.