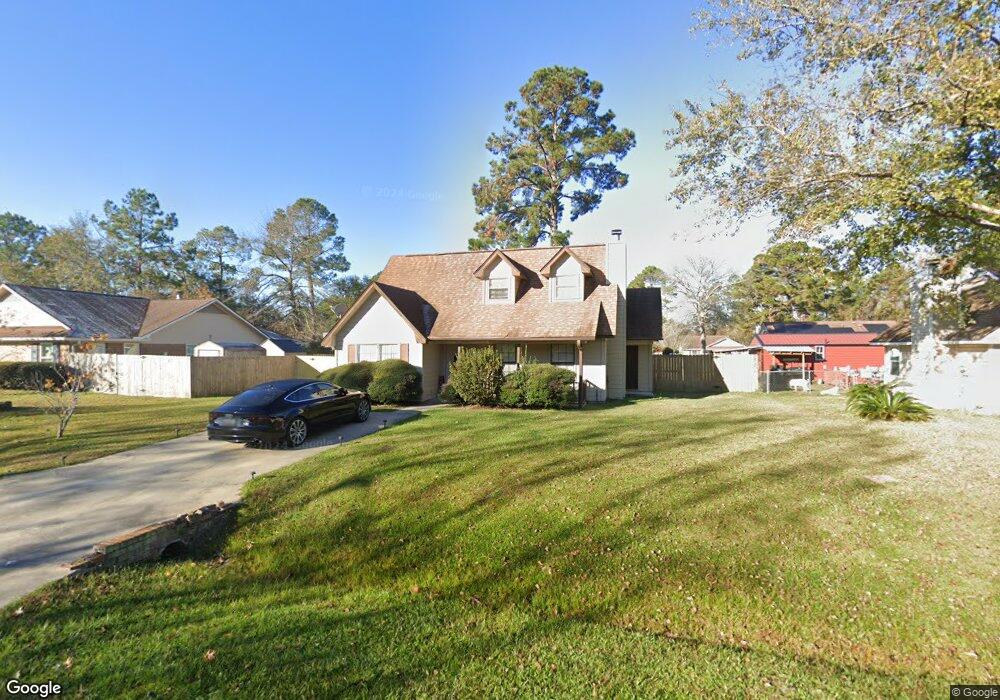
621 Scott St Hinesville, GA 31313
Estimated Value: $159,000 - $193,000
3
Beds
2
Baths
1,017
Sq Ft
$178/Sq Ft
Est. Value
About This Home
This home is located at 621 Scott St, Hinesville, GA 31313 and is currently estimated at $181,008, approximately $177 per square foot. 621 Scott St is a home located in Liberty County with nearby schools including Button Gwinnett Elementary School, Snelson-Golden Middle School, and Bradwell Institute.
Ownership History
Date
Name
Owned For
Owner Type
Purchase Details
Closed on
Apr 29, 2016
Sold by
Fearon Stewart R
Bought by
Slb Llc
Current Estimated Value
Purchase Details
Closed on
Jul 7, 1995
Bought by
Fearon Stewart R
Purchase Details
Closed on
May 20, 1994
Bought by
Kiefer Mark A and Kiefer Kar
Purchase Details
Closed on
Jun 1, 1993
Bought by
Secretary Of Va
Purchase Details
Closed on
Mar 26, 1990
Bought by
Liesueur John P and Liesueur Vronica M
Create a Home Valuation Report for This Property
The Home Valuation Report is an in-depth analysis detailing your home's value as well as a comparison with similar homes in the area
Home Values in the Area
Average Home Value in this Area
Purchase History
| Date | Buyer | Sale Price | Title Company |
|---|---|---|---|
| Slb Llc | -- | -- | |
| Fearon Stewart R | $67,100 | -- | |
| Kiefer Mark A | $68,000 | -- | |
| Secretary Of Va | -- | -- | |
| First Federal | -- | -- | |
| Liesueur John P | $65,300 | -- |
Source: Public Records
Tax History Compared to Growth
Tax History
| Year | Tax Paid | Tax Assessment Tax Assessment Total Assessment is a certain percentage of the fair market value that is determined by local assessors to be the total taxable value of land and additions on the property. | Land | Improvement |
|---|---|---|---|---|
| 2024 | $2,691 | $54,658 | $14,000 | $40,658 |
| 2023 | $2,691 | $48,300 | $12,000 | $36,300 |
| 2022 | $1,795 | $38,378 | $9,200 | $29,178 |
| 2021 | $1,675 | $35,142 | $9,200 | $25,942 |
| 2020 | $1,653 | $34,350 | $9,200 | $25,150 |
| 2019 | $1,641 | $34,350 | $9,200 | $25,150 |
| 2018 | $1,647 | $34,685 | $9,200 | $25,485 |
| 2017 | $1,142 | $34,685 | $9,200 | $25,485 |
| 2016 | $1,585 | $35,021 | $9,200 | $25,821 |
| 2015 | $1,464 | $30,273 | $6,800 | $23,473 |
| 2014 | $1,464 | $31,970 | $8,800 | $23,170 |
| 2013 | -- | $30,024 | $8,800 | $21,224 |
Source: Public Records
Map
Nearby Homes