Estimated Value: $383,965 - $475,000
3
Beds
3
Baths
2,566
Sq Ft
$167/Sq Ft
Est. Value
About This Home
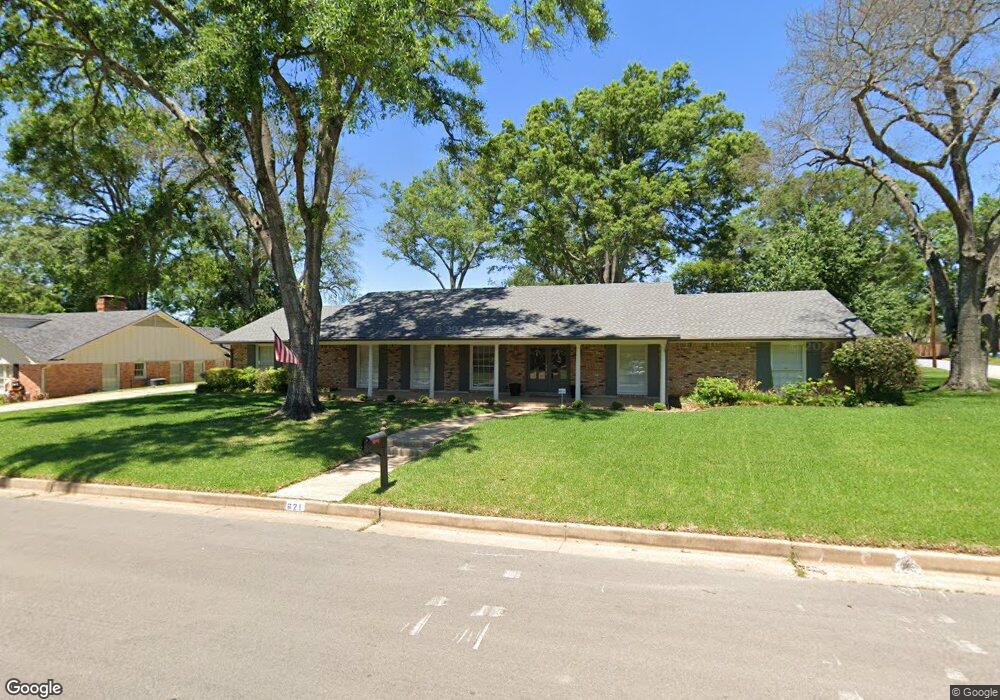
This home is located at 621 Trenton Dr, Tyler, TX 75703 and is currently estimated at $427,741, approximately $166 per square foot. 621 Trenton Dr is a home located in Smith County with nearby schools including Rice Elementary School, Hubbard Middle School, and Tyler Legacy High School.
Ownership History
Date
Name
Owned For
Owner Type
Purchase Details
Closed on
May 29, 2019
Sold by
Allen Jeffery and Allen Mica R
Bought by
Uzzell Jonathan Matt and Uzzell Claire Elise
Current Estimated Value
Home Financials for this Owner
Home Financials are based on the most recent Mortgage that was taken out on this home.
Original Mortgage
$274,919
Outstanding Balance
$240,714
Interest Rate
4.1%
Mortgage Type
Commercial
Estimated Equity
$187,027
Purchase Details
Closed on
Nov 30, 2016
Sold by
Newberry Brad A and Newberry Katherine S
Bought by
Allen Jeffery and Allen Mica R
Home Financials for this Owner
Home Financials are based on the most recent Mortgage that was taken out on this home.
Original Mortgage
$275,793
Interest Rate
3.87%
Mortgage Type
FHA
Create a Home Valuation Report for This Property
The Home Valuation Report is an in-depth analysis detailing your home's value as well as a comparison with similar homes in the area
Home Values in the Area
Average Home Value in this Area
Purchase History
| Date | Buyer | Sale Price | Title Company |
|---|---|---|---|
| Uzzell Jonathan Matt | -- | None Available | |
| Allen Jeffery | -- | None Available |
Source: Public Records
Mortgage History
| Date | Status | Borrower | Loan Amount |
|---|---|---|---|
| Open | Uzzell Jonathan Matt | $274,919 | |
| Previous Owner | Allen Jeffery | $275,793 |
Source: Public Records
Tax History Compared to Growth
Tax History
| Year | Tax Paid | Tax Assessment Tax Assessment Total Assessment is a certain percentage of the fair market value that is determined by local assessors to be the total taxable value of land and additions on the property. | Land | Improvement |
|---|---|---|---|---|
| 2025 | $5,384 | $356,230 | $54,156 | $302,074 |
| 2024 | $5,384 | $375,268 | $49,056 | $326,212 |
| 2023 | $6,578 | $405,935 | $49,056 | $356,879 |
| 2022 | $6,720 | $350,627 | $45,070 | $305,557 |
| 2021 | $6,543 | $311,842 | $45,070 | $266,772 |
| 2020 | $6,358 | $297,137 | $45,070 | $252,067 |
| 2019 | $4,562 | $208,648 | $30,660 | $177,988 |
| 2018 | $4,466 | $205,327 | $30,660 | $174,667 |
| 2017 | $4,384 | $205,327 | $30,660 | $174,667 |
| 2016 | $4,230 | $198,116 | $30,660 | $167,456 |
| 2015 | $1,634 | $197,483 | $30,660 | $166,823 |
| 2014 | $1,634 | $191,975 | $30,660 | $161,315 |
Source: Public Records
Map
Nearby Homes
- 429 Holiday Ln
- 418 Boyd Ln
- 7434 Waterview Square
- 6052 N Park Central Ct
- 604-606 Woodland Hills Dr
- 410 Brighton Ct
- 701 Woodland Hills Dr
- 504 Woodland Hills Dr
- 3829 Cloverdale Dr
- 815 Woodland Hills Dr
- 612 Rosemont Place II
- 3915 Post Oak Rd
- 4001 Darrell Ln
- 3617 Jill Cir
- 3606 Glendale Dr
- 3903 Appletree Ln
- 5106 Cloverdale Dr
- 3518 Cloverdale Dr
- 704 Paloma St
- 1317 Woodland Hills Dr
- 621 621 Trenton
- 701 Trenton Dr
- 4311 Candace Place
- 611 611 Trenton Dr
- 611 Trenton Dr
- 620 Trenton Dr
- 700 Trenton Dr
- 707 Trenton Dr
- 4310 Candace Place
- 616 Trenton Dr
- 707 707 Trenton
- 616 616 Trenton Dr
- 706 706 Trenton Dr
- 706 Trenton Dr
- 610 Trenton Dr
- 621 Barclay Dr
- 610 610 Trenton
- 701 Barclay Dr
- 4321 Richmond Rd
- 713 Trenton Dr